CAT 2019 Slot 2 DILR Q22
- Data Interpretation and Logical Reasoning
- Data Interpretation › Scatter Plot
- Easy
- Multiple choice
- CAT_2019_SLOT2_DILR_Q22
Data set · questions 21–24
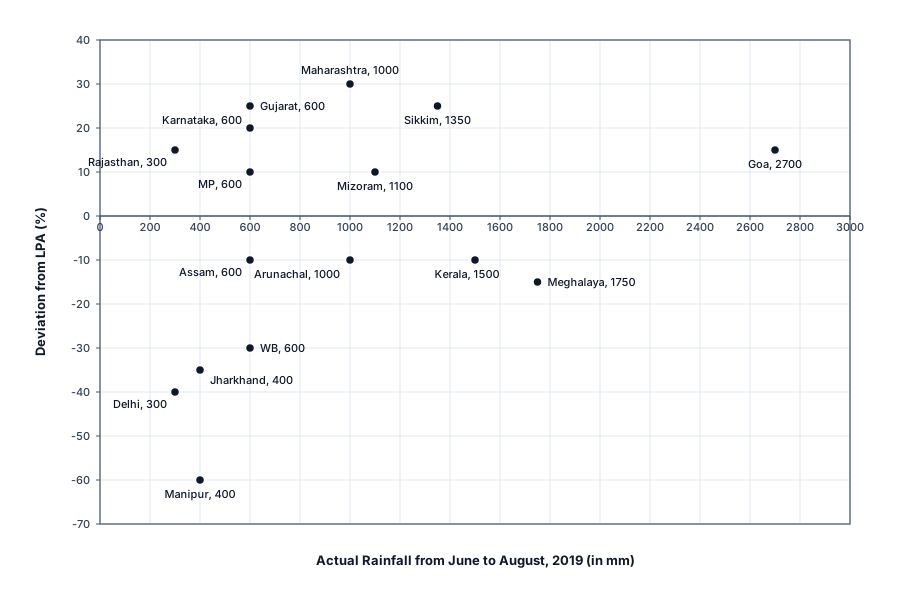
To compare the rainfall data, India Meteorological Department (IMD) calculated the Long Period Average (LPA) of rainfall during period June-August for each of the states. The figure given below shows the actual rainfall (measured in mm) during JuneAugust, and the percentage deviations from LPA of respective states in 2018. Each state along with its actual rainfall is presented in the figure.
Question 22
If a 'Low Monsoon State' is defined as a state with actual rainfall from June-August, of or less, then what is the median 'deviation from LPA' (as defined in the Y-axis of the figure) of 'Low Monsoon States'?
Show answer and solution
Answer: (D)
-10%
Solution
Concept: Order Statistics, Median Determination & Scatter Plot Decoupling
Master State Table
| State | Actual Rainfall 2019 (mm) | Deviation from LPA (%) | Baseline LPA (mm) |
|---|---|---|---|
| Delhi | 300 | -40% | 500.00 |
| Rajasthan | 300 | +15% | 260.87 |
| Jharkhand | 400 | -35% | 615.38 |
| Manipur | 400 | -60% | 1000.00 |
| Assam | 600 | -10% | 666.67 |
| Gujarat | 600 | +25% | 480.00 |
| Karnataka | 600 | +20% | 500.00 |
| Madhya Pradesh (MP) | 600 | +10% | 545.45 |
| West Bengal (WB) | 600 | -30% | 857.14 |
| Arunachal Pradesh | 1000 | -10% | 1111.11 |
| Maharashtra | 1000 | +30% | 769.23 |
| Mizoram | 1100 | +10% | 1000.00 |
| Sikkim | 1350 | +25% | 1080.00 |
| Kerala | 1500 | -10% | 1666.67 |
| Meghalaya | 1750 | -15% | 2058.82 |
| Goa | 2700 | +15% | 2347.83 |
Question Deduction
• Threshold Filtering for Low Monsoon States:
• A 'Low Monsoon State' is defined by actual rainfall .
• In the Master State Table, rainfall jumps from directly to , selecting all states with .
• Listing the qualifying states and their LPA deviations (-axis):
• Delhi ($-40\%$), Rajasthan ($+15\%$), Jharkhand ($-35\%$), Manipur ($-60\%$), Assam ($-10\%$), Gujarat ($+25\%$), Karnataka ($+20\%$), MP ($+10\%$), and WB ($-30\%$).
• Total count of Low Monsoon States: .
• Statistical Median Formulation:
• For an odd sample size , the median is given by the central order statistic:
$$\text{Median} = y_{\left(\frac{n+1}{2}\right)} = y_{(5)}$$
• Arranging the percentage deviations in strictly ascending algebraic order:
$$y_{(1)} = -60\% \text{ (Manipur)} < y_{(2)} = -40\% \text{ (Delhi)} < y_{(3)} = -35\% \text{ (Jharkhand)}$$

$$< y_{(4)} = -30\% \text{ (WB)} < \mathbf{y_{(5)} = -10\% \text{ (Assam)}} < y_{(6)} = +10\% \text{ (MP)}$$

$$< y_{(7)} = +15\% \text{ (Rajasthan)} < y_{(8)} = +20\% \text{ (Karnataka)} < y_{(9)} = +25\% \text{ (Gujarat)}$$
• With values below and above , the median is .
• Option Matching / Numerical Answer:
• The median deviation from LPA is , matching Option 4 precisely.
• Distractor analysis: Option 1 () represents ; Option 2 () is ungrounded; Option 3 () represents .
Topper Take
• Sign-balance shortcut: For , the median is the 5th value. Since states have negative deviations and have positive deviations, the median must simply be the least negative deviation.
• The least negative deviation is immediately seen as Assam at , bypassing full sorting in under 20 seconds.
Other questions in this set
- Q21. If a 'Heavy Monsoon State' is defined as a state with actual rainfall from June-August, 2019 of 900 mm or more, then…
- Q23. What is the average rainfall of all states that have actual rainfall of 600 mm or less in 2019 and have a negative…
- Q24. The LPA of a state for a year is defined as the average rainfall in the preceding 10 years considering the period of…
Scatter Plot questions from other CAT papers
- CAT 2025 Slot 2 DILR Q19
- CAT 2025 Slot 2 DILR Q20
- CAT 2025 Slot 2 DILR Q21
- CAT 2025 Slot 2 DILR Q22
- CAT 2024 Slot 2 DILR Q14
Practise this question with timing, notes and your mistake notebook.
Practise in PrepSoc