CAT 2025 Slot 2 DILR Q19
- Data Interpretation and Logical Reasoning
- Data Interpretation › Scatter Plot
- Hard
- Type in the answer (TITA)
- CAT_2025_SLOT2_DILR_Q19
Data set · questions 19–22
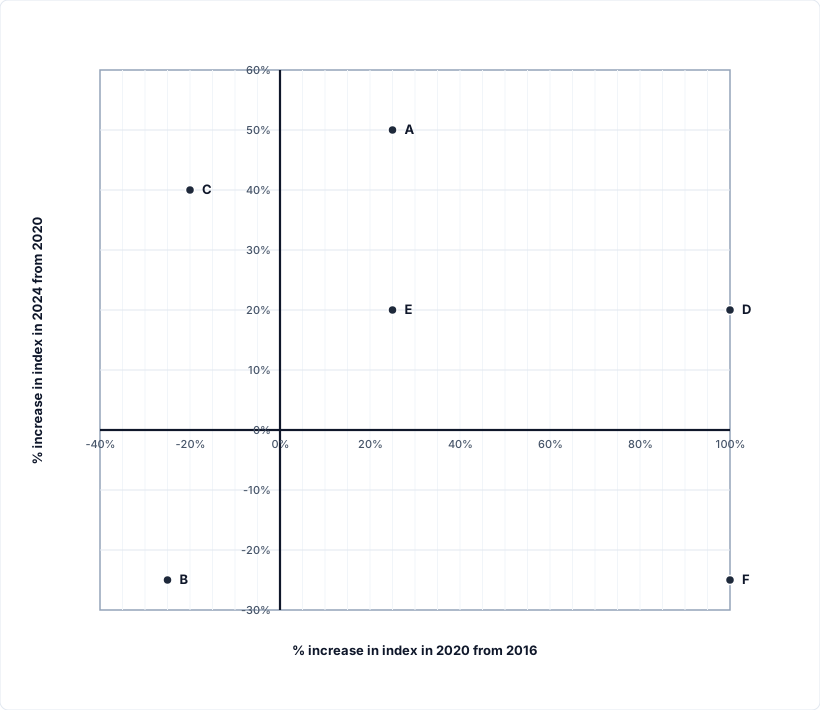
The Sustainability Index (SI) of a country at a point in time is an integer between 1 and 100. This question is related to SI of six countries - A, B, C, D, E, and F - at three different points in time - 2016, 2020, and 2024. The plot represents the exact changes in their SI, with X-coordinate representing % increase in 2020 from 2016, i.e., (SI in 2020 minus SI in 2016) / (SI in 2016), and Y-coordinate representing % increase in 2024 from 2020. At any point in time, the country with highest SI is ranked 1, while the country with the lowest SI is ranked 6. The following additional facts are known.
-
In 2016, B, C, E, and A had ranks 1, 2, 3, and 4 respectively.
-
F had lower SI than any other country in 2016, 2020, and 2024.
-
In 2024, E was the only country with SI of 90.
-
The range of SI of the six countries was 60 in 2016 as well as in 2024.
Question 19
What was the SI of E in 2016?
Type-in-the-answer (TITA) question: no options are given; enter the value.
Show answer and solution
Answer:
60
Solution
Concept: Multi-Period Compounded Growth & Index Tracking
Master State Table
| Country | 2016 to 2020 Growth () | 2020 to 2024 Growth () | Net Multiplier | 2016 Index | 2016 Rank | 2020 Index | 2020 Rank | 2024 Index | 2024 Rank |
|---|---|---|---|---|---|---|---|---|---|
| A | 4 | 4 | 4 | ||||||
| B | 5 | 5 | 5 | ||||||
| C | 1 | 1 | 1 | ||||||
| D | 2 | 2 | 2 | ||||||
| E | 3 | 3 | 3 |
Question Deduction
• The question explicitly asks for the Sustainability Index of country E in 2016 ().
• Fact 3 provides the terminal value: in 2024, E was the only country with an SI of 90, so .
• Extracting growth coordinates for E from the scatter plot:
• Percentage change from 2016 to 2020: .
• Percentage change from 2020 to 2024: .
• Computing the two-period cumulative growth multiplier:
• Inverting the cumulative multiplier to find the base value in 2016:
• Verifying the intermediate 2020 value:
Both 60 and 72 are exact integers within the valid domain .
• Rank consistency check: In 2016, E has rank 3. With (rank 2) and (rank 4), satisfies the strict ordering.
• Hence, the SI of E in 2016 was 60.
Topper Take
• Immediate Decoupled Execution: An elite test-taker scans the 4 questions before building the full 18-cell matrix. Question 1 depends solely on country E, whose 2024 value () and percentage multipliers (, ) are explicitly given. Solving requires zero information about the other 5 countries and secures a TITA mark within 20 seconds.
• Successive Percentage Addition Fallacy: A frequent blunder is adding percentages directly: , and then attempting . Successive percentage changes are multiplicative, not additive: .
Other questions in this set
- Q20. What was the SI of F in 2020?
- Q21. What was the SI of C in 2024?
- Q22. What was the SI of B in 2024?
Scatter Plot questions from other CAT papers
- CAT 2024 Slot 2 DILR Q14
- CAT 2024 Slot 2 DILR Q15
- CAT 2024 Slot 2 DILR Q16
- CAT 2024 Slot 2 DILR Q17
- CAT 2022 Slot 2 DILR Q11
Practise this question with timing, notes and your mistake notebook.
Practise in PrepSoc