CAT 2024 Slot 2 DILR Q14
- Data Interpretation and Logical Reasoning
- Data Interpretation › Scatter Plot
- Easy
- Multiple choice
- CAT_2024_SLOT2_DILR_Q14
Data set · questions 14–17
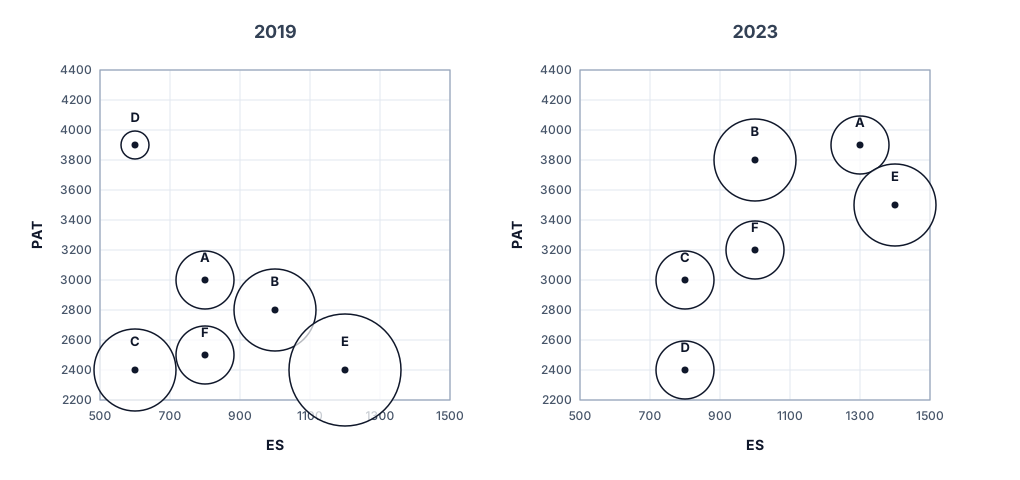
The two plots below give the following information about six firms A, B, C, D, E, and F for and .
PAT: The firm's profits after taxes in Rs. crores,
ES: The firm's employee strength, that is the number of employees in the firm, and
PRD: The percentage of the firm's PAT that they spend on Research and Development (R&D).
In the plots, the horizontal and vertical coordinates of point representing each firm gives their ES and PAT values respectively. The PRD values of each firm are proportional to the areas around the points representing each firm. The areas are comparable between the two plots, i.e., equal areas in the two plots represent the same PRD values for the two years.
Question 14
Assume that the annual rate of growth in PAT over the previous year (ARG) remained constant over the years for each of the six firms. Which among the firms A, B, C, and E had the highest ARG?
Show answer and solution
Answer: (A)
Firm E
Solution
Concept: Corporate Financial Metrics & Scatter Coordinate Analysis
Master State Table
| Firm | ES '19 | PAT '19 ( Cr) | PRD '19 (%) | ES '23 | PAT '23 ( Cr) | PRD '23 (%) | PAT Growth () | PAT / ES '23 ( Cr/Emp) | Total R&D '23 ( Cr) | R&D / ES '23 ( Cr/Emp) |
|---|---|---|---|---|---|---|---|---|---|---|
| A | 40 | 20 | 50 | 30 | ||||||
| B | 35 | 25 | 40 | 45 | ||||||
| C | 25 | 30 | 20 | 60 | ||||||
| D | 55 | 35 | 60 | 40 | ||||||
| E | 20 | 10 | 30 | 50 | ||||||
| F | 65 | 55 | 70 | 70 |
Question Deduction
We seek the firm with the highest Annual Rate of Growth (ARG) in PAT over the 4-year horizon (2019 to 2023) among firms and .
• Mathematical Formulation:
• The compounding relationship over the 4-year span is given by:
• Because the exponent is strictly monotonic, maximizing is mathematically equivalent to maximizing the overall growth ratio:
• Evaluating Growth Multipliers for Candidate Firms:
• Firm A:
• Firm B:
• Firm C:
• Firm E:
• Comparative Analysis:
Firm achieved a massive -fold increase in profit after tax (), far exceeding Firm (), Firm (), and Firm ().
Therefore, Firm E had the highest ARG (Option 1).
Topper Take
• Compounding Monotonicity Shortcut: When evaluating annual compounding growth rates over an identical multi-year time horizon across candidates, never calculate fractional exponents. The ratio directly preserves ranking order.
Other questions in this set
- Q15. The ratio of the amount of money spent by Firm C on R&D in 2018 to that in 2023 is closest to
- Q16. Which among the firms A, C, E, and F had the maximum PAT per employee in 2023?
- Q17. Which among the firms C, D, E, and F had the least amount of R & D spending per employee in 2023?
Scatter Plot questions from other CAT papers
- CAT 2025 Slot 2 DILR Q19
- CAT 2025 Slot 2 DILR Q20
- CAT 2025 Slot 2 DILR Q21
- CAT 2025 Slot 2 DILR Q22
- CAT 2022 Slot 2 DILR Q11
Practise this question with timing, notes and your mistake notebook.
Practise in PrepSoc