CAT 2025 Slot 2 DILR Q21
- Data Interpretation and Logical Reasoning
- Data Interpretation › Scatter Plot
- Hard
- Type in the answer (TITA)
- CAT_2025_SLOT2_DILR_Q21
Data set · questions 19–22
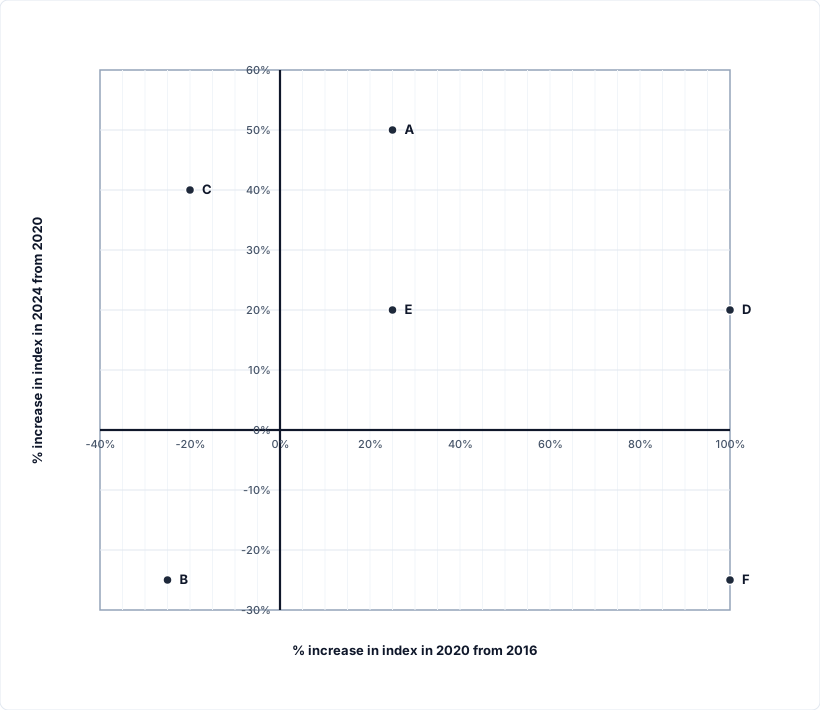
The Sustainability Index (SI) of a country at a point in time is an integer between 1 and 100. This question is related to SI of six countries - A, B, C, D, E, and F - at three different points in time - 2016, 2020, and 2024. The plot represents the exact changes in their SI, with X-coordinate representing % increase in 2020 from 2016, i.e., (SI in 2020 minus SI in 2016) / (SI in 2016), and Y-coordinate representing % increase in 2024 from 2020. At any point in time, the country with highest SI is ranked 1, while the country with the lowest SI is ranked 6. The following additional facts are known.
-
In 2016, B, C, E, and A had ranks 1, 2, 3, and 4 respectively.
-
F had lower SI than any other country in 2016, 2020, and 2024.
-
In 2024, E was the only country with SI of 90.
-
The range of SI of the six countries was 60 in 2016 as well as in 2024.
Question 21
What was the SI of C in 2024?
Type-in-the-answer (TITA) question: no options are given; enter the value.
Show answer and solution
Answer:
84
Solution
Concept: Multi-Period Compounded Growth & Index Tracking
Master State Table
| Country | 2016 to 2020 Growth () | 2020 to 2024 Growth () | Net Multiplier | 2016 Index | 2016 Rank | 2020 Index | 2020 Rank | 2024 Index | 2024 Rank |
|---|---|---|---|---|---|---|---|---|---|
| A | 4 | 4 | 4 | ||||||
| B | 5 | 5 | 5 | ||||||
| C | 1 | 1 | 1 | ||||||
| D | 2 | 2 | 2 | ||||||
| E | 3 | 3 | 3 |
Question Deduction
• The question targets the Sustainability Index of country C in 2024 ().
• Tracing the rank boundary constraints for C in 2016:
• Country B has rank 1 with .
• Country E has rank 3 with .
• Country C has rank 2, establishing the strict inequality:
• Integrating the integer multiplier requirement:
• For Country C, the scatter plot gives and .
• Growth from 2016 to 2020 is :
• For to be an integer, must be divisible by 20.
• The set of integer multiples of 20 strictly between 60 and 100 contains exactly one element:
• Therefore, is uniquely established.
• Computing the index for subsequent periods:
• In 2020:
• In 2024, the vertical change is (zero percentage growth):
• Hence, the SI of C in 2024 was 84.
Topper Take
• The "Multiple of 20" Mathematical Wedge: Test-takers who struggle with this set typically miss the power of integer constraints. The fraction acts as a precision filter. Between the strict bounds of 60 and 100, there is literally only one number divisible by 20, immediately resolving country C without trial and error.
• Year-Confusion Trap: A common careless error is calculating and entering 80 as the answer. The question specifically asks for the SI of C in 2024. Applying the growth produces 84. Always re-read the target year before submitting a numerical response.
Other questions in this set
- Q19. What was the SI of E in 2016?
- Q20. What was the SI of F in 2020?
- Q22. What was the SI of B in 2024?
Scatter Plot questions from other CAT papers
- CAT 2024 Slot 2 DILR Q14
- CAT 2024 Slot 2 DILR Q15
- CAT 2024 Slot 2 DILR Q16
- CAT 2024 Slot 2 DILR Q17
- CAT 2022 Slot 2 DILR Q11
Practise this question with timing, notes and your mistake notebook.
Practise in PrepSoc