CAT 2025 Slot 2 DILR Q22
- Data Interpretation and Logical Reasoning
- Data Interpretation › Scatter Plot
- Hard
- Multiple choice
- CAT_2025_SLOT2_DILR_Q22
Data set · questions 19–22
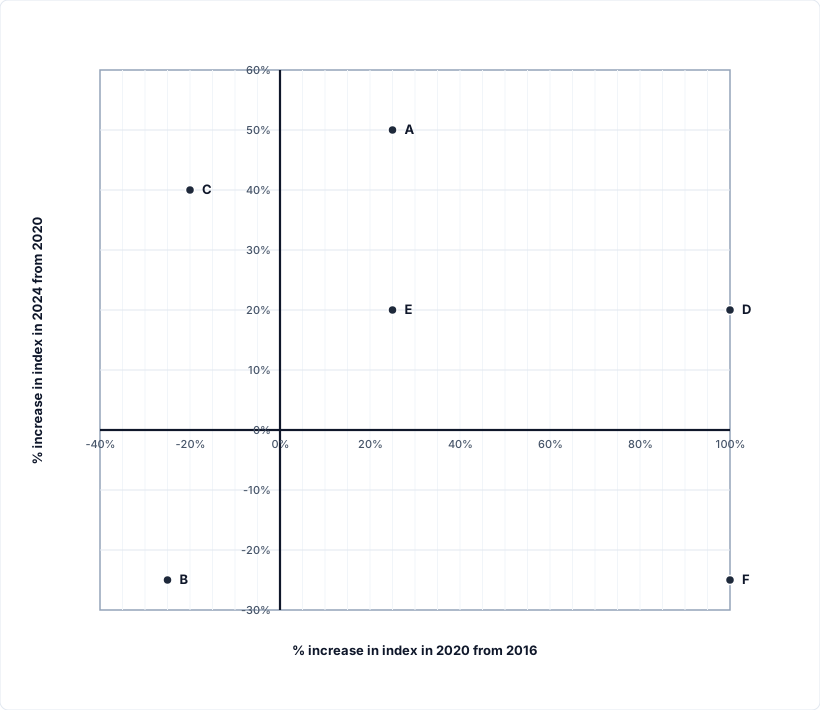
The Sustainability Index (SI) of a country at a point in time is an integer between 1 and 100. This question is related to SI of six countries - A, B, C, D, E, and F - at three different points in time - 2016, 2020, and 2024. The plot represents the exact changes in their SI, with X-coordinate representing % increase in 2020 from 2016, i.e., (SI in 2020 minus SI in 2016) / (SI in 2016), and Y-coordinate representing % increase in 2024 from 2020. At any point in time, the country with highest SI is ranked 1, while the country with the lowest SI is ranked 6. The following additional facts are known.
-
In 2016, B, C, E, and A had ranks 1, 2, 3, and 4 respectively.
-
F had lower SI than any other country in 2016, 2020, and 2024.
-
In 2024, E was the only country with SI of 90.
-
The range of SI of the six countries was 60 in 2016 as well as in 2024.
Question 22
What was the SI of B in 2024?
Show answer and solution
Answer:
45
Solution
Concept: Multi-Period Compounded Growth & Index Tracking
Master State Table
| Country | 2016 to 2020 Growth () | 2020 to 2024 Growth () | Net Multiplier | 2016 Index | 2016 Rank | 2020 Index | 2020 Rank | 2024 Index | 2024 Rank |
|---|---|---|---|---|---|---|---|---|---|
| A | 4 | 4 | 4 | ||||||
| B | 5 | 5 | 5 | ||||||
| C | 1 | 1 | 1 | ||||||
| D | 2 | 2 | 2 | ||||||
| E | 3 | 3 | 3 |
Question Deduction
• The question targets the Sustainability Index of country B in 2024 ().
• Determining from the 2016 Range Invariant:
• Country B holds rank 1 in 2016 (the highest SI among all countries).
• Country F holds rank 6 in 2016 (the lowest SI among all countries, with ).
• Fact 4 specifies that the range in 2016 was 60:
• Tracing B's Trajectory via Plot Multipliers:
• Coordinate from the plot for B: and .
• In Period 1 (2016 to 2020), B decreases by :
• In Period 2 (2020 to 2024), B decreases by :
• Direct Composite Multiplier Formulation:
• Evaluating Options:
• Option 1 (): Incorrect. Corresponds to country D's 2024 score.
• Option 2 (): Incorrect. Corresponds to country E's 2016 score or country A's 2020 score.
• Option 3 (): Exactly matches the derived value .
• Option 4 (): Incorrect. Corresponds to country C's 2016 score.
• Hence, the SI of B in 2024 was 45, which corresponds to Option 3.
Topper Take
• Psychological Anchoring Bias: Candidates often assume that because B was the undisputed rank 1 superpower in 2016 (), its score must remain high in 2024. In reality, B suffers the steepest compounded contraction in the set: followed by , cutting its value by down to (dropping all the way to rank 5).
• Rapid MCQ Option Elimination: Country B's net multiplier from 2016 to 2024 is . Because is an integer divisible by 20, must be an exact multiple of 9!
Other questions in this set
- Q19. What was the SI of E in 2016?
- Q20. What was the SI of F in 2020?
- Q21. What was the SI of C in 2024?
Scatter Plot questions from other CAT papers
- CAT 2024 Slot 2 DILR Q14
- CAT 2024 Slot 2 DILR Q15
- CAT 2024 Slot 2 DILR Q16
- CAT 2024 Slot 2 DILR Q17
- CAT 2022 Slot 2 DILR Q11
Practise this question with timing, notes and your mistake notebook.
Practise in PrepSoc