CAT 2025 Slot 2 DILR Q20
- Data Interpretation and Logical Reasoning
- Data Interpretation › Scatter Plot
- Hard
- Type in the answer (TITA)
- CAT_2025_SLOT2_DILR_Q20
Data set · questions 19–22
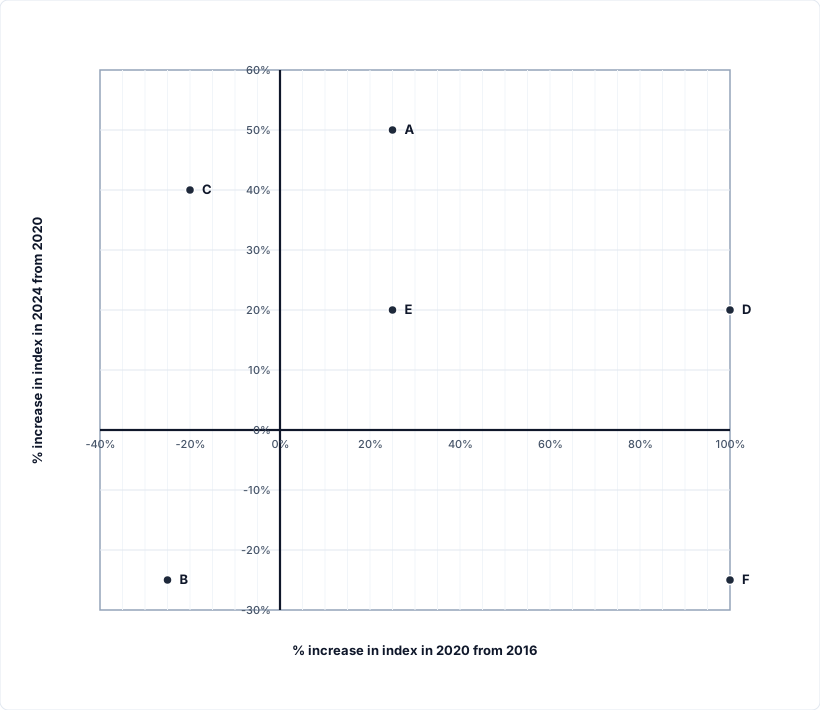
The Sustainability Index (SI) of a country at a point in time is an integer between 1 and 100. This question is related to SI of six countries - A, B, C, D, E, and F - at three different points in time - 2016, 2020, and 2024. The plot represents the exact changes in their SI, with X-coordinate representing % increase in 2020 from 2016, i.e., (SI in 2020 minus SI in 2016) / (SI in 2016), and Y-coordinate representing % increase in 2024 from 2020. At any point in time, the country with highest SI is ranked 1, while the country with the lowest SI is ranked 6. The following additional facts are known.
-
In 2016, B, C, E, and A had ranks 1, 2, 3, and 4 respectively.
-
F had lower SI than any other country in 2016, 2020, and 2024.
-
In 2024, E was the only country with SI of 90.
-
The range of SI of the six countries was 60 in 2016 as well as in 2024.
Question 20
What was the SI of F in 2020?
Type-in-the-answer (TITA) question: no options are given; enter the value.
Show answer and solution
Answer:
40
Solution
Concept: Multi-Period Compounded Growth & Index Tracking
Master State Table
| Country | 2016 to 2020 Growth () | 2020 to 2024 Growth () | Net Multiplier | 2016 Index | 2016 Rank | 2020 Index | 2020 Rank | 2024 Index | 2024 Rank |
|---|---|---|---|---|---|---|---|---|---|
| A | 4 | 4 | 4 | ||||||
| B | 5 | 5 | 5 | ||||||
| C | 1 | 1 | 1 | ||||||
| D | 2 | 2 | 2 | ||||||
| E | 3 | 3 | 3 |
Question Deduction
• The question targets the Sustainability Index of country F in 2020 ().
• Fact 2 states F had a lower SI than any other country in 2016, 2020, and 2024. Therefore, F is the minimum in 2024:
• Fact 4 specifies that the range in 2024 was 60:
• Fact 3 establishes that E was the only country with an SI of 90 in 2024. As proven in the Master Deduction, no other country can reach or exceed 90, meaning .
• Deriving F's index in 2024:
• Tracing back to 2020 using the scatter plot data for F:
• Coordinate for F: (percentage change from 2020 to 2024).
• This corresponds to a multiplier of :
• Inverting the fractional relation:
• Sanity Check with Fact 2:
In 2020, the index values of all six countries are:
• Country C: 84
• Country B: 75
• Country E: 72
• Country A: 60
• Country D: 54
• Country F: 40
Here, , strictly confirming that F is lower than every other country in 2020.
• Hence, the SI of F in 2020 was 40.
Topper Take
• Unjustified Range Extrapolation: Fact 4 states that the range was 60 in 2016 and 2024. A critical trap is assuming the range was 60 in 2020 as well! In reality, the range in 2020 is . Aspirants who blindly assume derail their entire deduction.
• Percentage Reversal Inversion Error: When reversing a reduction from 30 back to the base value, many test-takers mistakenly add of 30, computing . A reduction means the final value is of the initial value; reversing it requires dividing by (or multiplying by ), yielding the clean integer 40.
Other questions in this set
- Q19. What was the SI of E in 2016?
- Q21. What was the SI of C in 2024?
- Q22. What was the SI of B in 2024?
Scatter Plot questions from other CAT papers
- CAT 2024 Slot 2 DILR Q14
- CAT 2024 Slot 2 DILR Q15
- CAT 2024 Slot 2 DILR Q16
- CAT 2024 Slot 2 DILR Q17
- CAT 2022 Slot 2 DILR Q11
Practise this question with timing, notes and your mistake notebook.
Practise in PrepSoc