CAT 2019 Slot 2 DILR Q21
- Data Interpretation and Logical Reasoning
- Data Interpretation › Scatter Plot
- Easy
- Multiple choice
- CAT_2019_SLOT2_DILR_Q21
Data set · questions 21–24
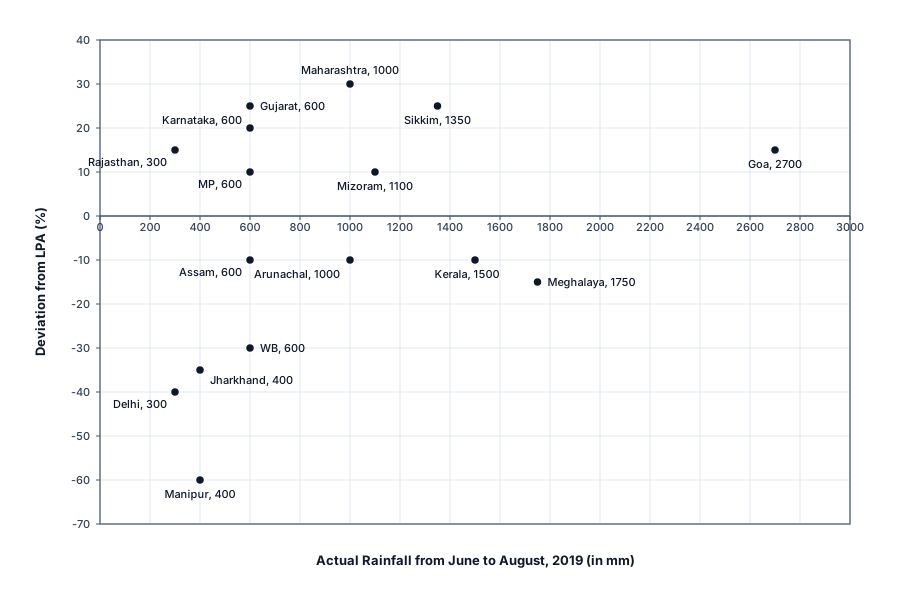
To compare the rainfall data, India Meteorological Department (IMD) calculated the Long Period Average (LPA) of rainfall during period June-August for each of the states. The figure given below shows the actual rainfall (measured in mm) during JuneAugust, and the percentage deviations from LPA of respective states in 2018. Each state along with its actual rainfall is presented in the figure.
Question 21
If a 'Heavy Monsoon State' is defined as a state with actual rainfall from June-August, 2019 of mm or more, then approximately what percentage of 'Heavy Monsoon States' have a negative deviation from respective LPAs in 2019?
Show answer and solution
Answer: (D)
Solution
Concept: Scatter Plot Interpretation, Threshold Filtering & Proportion Analysis
Master State Table
| State | Actual Rainfall 2019 (mm) | Deviation from LPA (%) | Baseline LPA (mm) |
|---|---|---|---|
| Delhi | 300 | -40% | 500.00 |
| Rajasthan | 300 | +15% | 260.87 |
| Jharkhand | 400 | -35% | 615.38 |
| Manipur | 400 | -60% | 1000.00 |
| Assam | 600 | -10% | 666.67 |
| Gujarat | 600 | +25% | 480.00 |
| Karnataka | 600 | +20% | 500.00 |
| Madhya Pradesh (MP) | 600 | +10% | 545.45 |
| West Bengal (WB) | 600 | -30% | 857.14 |
| Arunachal Pradesh | 1000 | -10% | 1111.11 |
| Maharashtra | 1000 | +30% | 769.23 |
| Mizoram | 1100 | +10% | 1000.00 |
| Sikkim | 1350 | +25% | 1080.00 |
| Kerala | 1500 | -10% | 1666.67 |
| Meghalaya | 1750 | -15% | 2058.82 |
| Goa | 2700 | +15% | 2347.83 |
Question Deduction
• Threshold Filtering for Heavy Monsoon States:
• A 'Heavy Monsoon State' satisfies .
• From the Master State Table, exactly states qualify: Maharashtra (), Arunachal Pradesh (), Mizoram (), Sikkim (), Kerala (), Meghalaya (), and Goa () .
• All other states have and are excluded.
• Partitioning by LPA Deviation Sign:
• Negative deviation corresponds to points below the baseline.
• Among the Heavy Monsoon States:
• **Negative Deviation ($< 0\%$)**: Arunachal Pradesh ($-10\%$), Kerala ($-10\%$), Meghalaya ($-15\%$) $\implies N_{\text{negative}} = 3$.

• **Positive Deviation ($> 0\%$)**: Maharashtra ($+30\%$), Mizoram ($+10\%$), Sikkim ($+25\%$), Goa ($+15\%$) $\implies N_{\text{positive}} = 4$.
• Balance check: .
• Percentage Formulation & Computation:
• The percentage of Heavy Monsoon States with negative deviation from LPA is:
$$\text{Percentage} = \frac{N_{\text{negative}}}{N_{\text{heavy}}} \times 100\% = \frac{3}{7} \times 100\%$$
• Evaluating the fraction:
$$\frac{3}{7} \times 100\% \approx 42.857\% \approx 42.86\%$$
• Option Matching / Numerical Answer:
• The computed value of matches Option 4 precisely.
• Distractor analysis: Option 1 () represents positive deviation states (); Option 2 () is ; Option 3 () is .
Topper Take
• Visual triage: Draw a mental vertical line at ; count points to the right, then count points in the fourth quadrant below the axis.
• Speed shortcut: Recognizing confirms Option 4 in under 30 seconds.
Other questions in this set
- Q22. If a 'Low Monsoon State' is defined as a state with actual rainfall from June-August, 2019 of 750 mm or less, then…
- Q23. What is the average rainfall of all states that have actual rainfall of 600 mm or less in 2019 and have a negative…
- Q24. The LPA of a state for a year is defined as the average rainfall in the preceding 10 years considering the period of…
Scatter Plot questions from other CAT papers
- CAT 2025 Slot 2 DILR Q19
- CAT 2025 Slot 2 DILR Q20
- CAT 2025 Slot 2 DILR Q21
- CAT 2025 Slot 2 DILR Q22
- CAT 2024 Slot 2 DILR Q14
Practise this question with timing, notes and your mistake notebook.
Practise in PrepSoc