CAT 2024 Slot 2 DILR Q13
- Data Interpretation and Logical Reasoning
- Data Interpretation › Bar Graphs
- Medium
- Multiple choice
- CAT_2024_SLOT2_DILR_Q13
Data set · questions 10–13
An online e-commerce firm receives daily integer product ratings from 1 through 5 given by buyers. The daily average is the average of the ratings given on that day. The cumulative average is the average of all ratings given on or before that day.
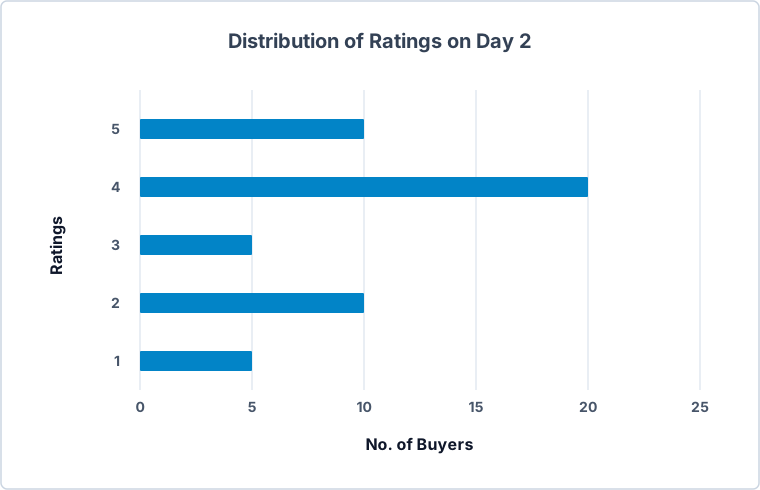
The rating system began on Day 1, and the cumulative averages were 3 and 3.1 at the end of Day 1 and Day 2, respectively. The distribution of ratings on Day 2 is given in the figure below.
The following information is known about ratings on Day 3.
- 100 buyers gave product ratings on Day 3.
- The modes of the product ratings were 4 and 5.
- The numbers of buyers giving each product rating are non-zero multiples of 10.
- The same number of buyers gave product ratings of 1 and 2, and that number is half the number of buyers who gave a rating of 3.
Question 13
Which of the following is true about the cumulative average ratings of Day 2 and Day 3?
Show answer and solution
Answer: (D)
4. The cumulative average of Day 3 increased by a percentage between 5% and 8% from Day 2.
Solution
Concept: Cumulative Rating Distribution & Interval Bounds
Master State Table
Rating Distribution by Score (Days 2 & 3)
| Rating Score | Day 2 Buyers | Day 3 Buyers |
|---|---|---|
| 1 | 5 | 10 |
| 2 | 10 | 10 |
| 3 | 5 | 20 |
| 4 | 20 | 30 |
| 5 | 10 | 30 |
| Total Buyers | 50 | 100 |
| Daily Rating Sum | 170 | 360 |
Daily & Cumulative Aggregate Metrics (Days 1–3)
| Day | Daily Buyers | Daily Rating Sum | Daily Average | Cumulative Buyers | Cumulative Sum | Cumulative Average |
|---|---|---|---|---|---|---|
| Day 1 | 150 | 450 | 3.000 | 150 | 450 | 3.000 |
| Day 2 | 50 | 170 | 3.400 | 200 | 620 | 3.100 |
| Day 3 | 100 | 360 | 3.600 | 300 | 980 | 3.267 () |
Question Deduction
• Target Variable: Comparative percentage shift in cumulative average rating from Day 2 to Day 3.
• Day 2 Cumulative Baseline:
• Cumulative buyers through Day 2: .
• Cumulative rating score sum through Day 2: .
• Cumulative Average at Day 2: .
• Day 3 Cumulative State:
• Day 3 contributes buyers and score points.
• Total cumulative buyers through Day 3: .
• Total cumulative rating score sum through Day 3: .
• Cumulative Average at Day 3: .
• Percentage Change Calculation:
• Absolute increase: .
• Percentage growth:
• Option Elimination & Verification:
• Option 1 (decreased): False, as .
• Option 2 (increased by more than ): False, since .
• Option 3 (increased by less than ): False, since .
• Option 4 (increased by between and ): True ().
Topper Take
• Fractional Bound Check: Avoid manual long division of percentages. Calculate and of the base : and .
Other questions in this set
- Q10. How many buyers gave ratings on Day 1?
- Q11. What is the daily average rating of Day 3?
- Q12. What is the median of all ratings given on Day 3?
Bar Graphs questions from other CAT papers
- CAT 2025 Slot 2 DILR Q15
- CAT 2025 Slot 2 DILR Q16
- CAT 2025 Slot 2 DILR Q17
- CAT 2025 Slot 2 DILR Q18
- CAT 2022 Slot 3 DILR Q6
Practise this question with timing, notes and your mistake notebook.
Practise in PrepSoc