CAT 2022 Slot 2 DILR Q13
- Data Interpretation and Logical Reasoning
- Data Interpretation › Scatter Plot
- Easy
- Multiple choice
- CAT_2022_SLOT2_DILR_Q13
Data set · questions 11–15
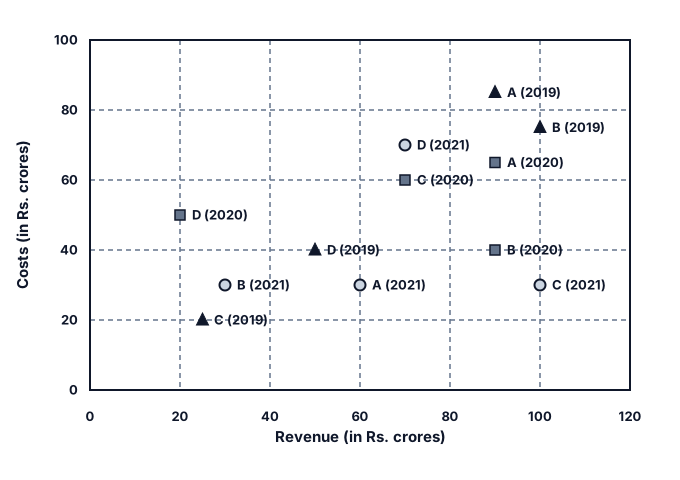
The two plots below show data for four companies code-named A, B, C, and D over three years - 2019, 2020, and . The first plot shows the revenues and costs incurred by the companies during these years. For example, in 2021, company C earned Rs. crores in revenue and spent Rs. crores. The profit of a company is defined as its revenue minus its costs.
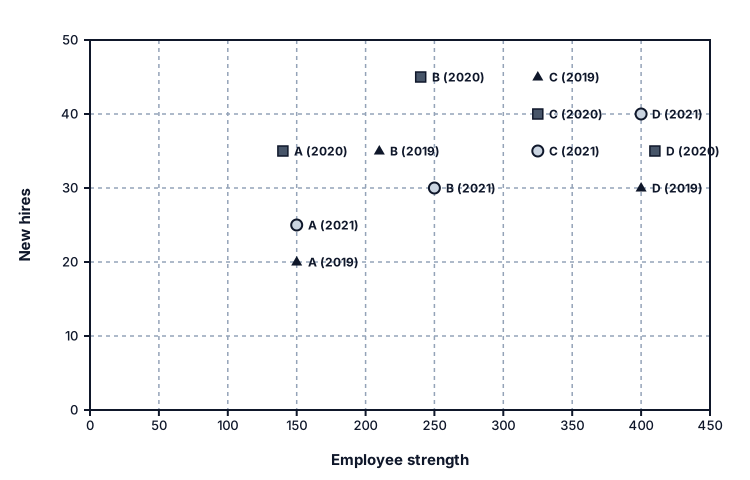
The second plot shows the number of employees employed by the company (employee strength) at the start of each of these three years, as well as the number of new employees hired each year (new hires). For example, Company B had employees at the start of 2021, and new employees joined the company during the year.
Question 13
The ratio of a company's annual profit to its annual costs is a measure of its performance. Which of the four companies had the lowest value of this ratio in 2019?
Show answer and solution
Answer: (A)
Company A
Solution
Concept: Scatter Plot Coordinate Extraction, Financial Metrics & Workforce Attrition Flow
Master State Table
| Company | Year | Revenue (₹ Cr) | Cost (₹ Cr) | Annual Profit (₹ Cr) | Profit/Cost Ratio | Start Strength () | New Hires () | End Strength | Employees Lost () |
|---|---|---|---|---|---|---|---|---|---|
| A | 2019 | 90 | 85 | 5 | 400 | 50 | 350 | 100 | |
| A | 2020 | 70 | 55 | 15 | 350 | 30 | 320 | 60 | |
| A | 2021 | 80 | 60 | 20 | 320 | 30 | — | — | |
| B | 2019 | 100 | 75 | 25 | 220 | 40 | 240 | 20 | |
| B | 2020 | 90 | 50 | 40 | 240 | 20 | 250 | 10 | |
| B | 2021 | 75 | 45 | 30 | 250 | 30 | — | — | |
| C | 2019 | 23 | 20 | 3 | 80 | 30 | 90 | 20 | |
| C | 2020 | 40 | 20 | 20 | 90 | 25 | 100 | 15 | |
| C | 2021 | 100 | 30 | 70 | 100 | — | — | — | |
| D | 2019 | 50 | 40 | 10 | 150 | 30 | 120 | 60 | |
| D | 2020 | 20 | 50 | -30 (Loss 30) | Negative | 120 | 10 | 100 | 30 |
| D | 2021 | 60 | 40 | 20 | 100 | — | — | — |
Question Deduction
• Extracting 2019 Performance Ratio:
• Metric: in 2019 (triangle symbol ▲).
• Computing Ratio for Each Company in 2019:
• Company A:
• Revenue $= 90$, Cost $= 85 \implies$ Profit $= 5$.

• Ratio $= \frac{5}{85} = \frac{1}{17} \approx 0.0588$ ($5.88\%$).
• Company B:
• Revenue $= 100$, Cost $= 75 \implies$ Profit $= 25$.

• Ratio $= \frac{25}{75} = \frac{1}{3} \approx 0.3333$ ($33.33\%$).
• Company C:
• Revenue $= 23$, Cost $= 20 \implies$ Profit $= 3$.

• Ratio $= \frac{3}{20} = 0.1500$ ($15.0\%$).
• Company D:
• Revenue $= 50$, Cost $= 40 \implies$ Profit $= 10$.

• Ratio $= \frac{10}{40} = \frac{1}{4} = 0.2500$ ($25.0\%$).
• Comparison:
• The lowest performance ratio is , belonging to Company A.
• Option Matching:
• Matches Option 1 (Company A).
Topper Take
• Fraction Comparison: Company A has Profit/Cost . All others exceed . Company A is lowest.
Other questions in this set
- Q11. Considering all three years, which company had the highest annual profit?
- Q12. Which of the four companies experienced the highest annual loss in any of the years?
- Q14. The total number of employees lost in 2019 and 2020 was the least for:
- Q15. Profit per employee is the ratio of a company's profit to its employee strength. For this purpose, the employee…
Scatter Plot questions from other CAT papers
- CAT 2025 Slot 2 DILR Q19
- CAT 2025 Slot 2 DILR Q20
- CAT 2025 Slot 2 DILR Q21
- CAT 2025 Slot 2 DILR Q22
- CAT 2024 Slot 2 DILR Q14
Practise this question with timing, notes and your mistake notebook.
Practise in PrepSoc