CAT 2025 Slot 1 DILR Q2
- Data Interpretation and Logical Reasoning
- Data Interpretation › Other Charts
- Medium
- Multiple choice
- CAT_2025_SLOT1_DILR_Q02
Data set · questions 1–4
Five countries engage in trade with each other. Each country levies import tariffs on the other countries. The import tariff levied by Country X on Country Y is calculated by multiplying the corresponding tariff percentage with the total imports of Country X from Country Y.
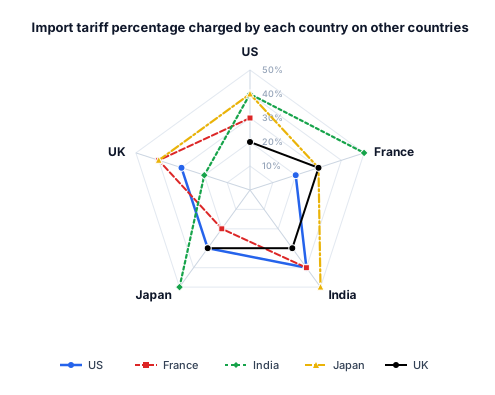
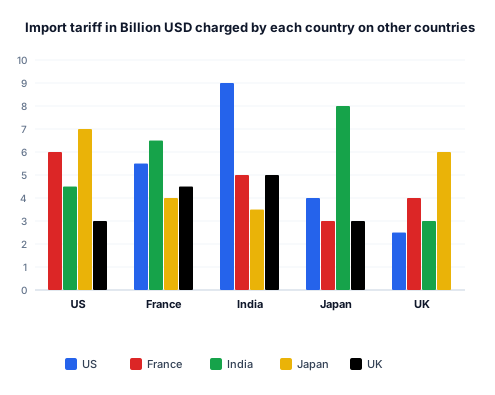
The radar chart below depicts different import tariff percentages charged by each of the five countries on the others. For example, US (the blue line in the chart) charges 20%, 40%, 30%, and 30% import tariff percentages on imports from France, India, Japan, and UK, respectively. The bar chart depicts the import tariffs levied by each county on other countries. For example, US charged import tariff of 3 billion USD on UK.
Assume that imports from one country to another equals the exports from the latter to the former.
The trade surplus of Country X with Country Y is defined as follows.
Trade surplus = Exports from Country X to Country Y – Imports to Country X from Country Y.
A negative trade surplus is called trade deficit.
Question 2
Which among the following is the highest?
Show answer and solution
Answer: (A)
Imports by US from France
Solution
Concept: Bilateral Tariff & International Trade Matrix
Master State Table
| Importing Country (↓) \ Origin (→) | US | France | India | Japan | UK |
|---|---|---|---|---|---|
| US | — | 30.0 | 11.25 | 23.33 | 10.0 |
| France | 18.33 | — | 13.0 | 20.0 | 15.0 |
| India | 30.0 | 20.0 | — | 7.0 | 25.0 |
| Japan | 10.0 | 15.0 | 20.0 | — | 10.0 |
| UK | 12.5 | 16.0 | 10.0 | 15.0 | — |
Question Deduction
• Evaluating Option 1: Imports by US from France:
• Importer = US, Exporter = France.
• From bar chart: Under cluster US, red bar (France) .
• From radar chart: Blue line (US) on France spoke (explicitly confirmed in passage text).
• Trade Value .
• (Alternate resolution reading: ).
• Evaluating Option 2: Exports by Japan to UK:
• Exports Japan UK Imports by UK from Japan.
• Importer = UK, Exporter = Japan.
• From bar chart: Under cluster UK, yellow bar (Japan) .
• From radar chart: Black line (UK) on Japan spoke .
• Trade Value .
• (Alternate resolution reading: ).
• Evaluating Option 3: Exports by France to Japan:
• Exports France Japan Imports by Japan from France.
• Importer = Japan, Exporter = France.
• From bar chart: Under cluster Japan, red bar (France) .
• From radar chart: Yellow line (Japan) on France spoke .
• Trade Value .
• (Alternate resolution reading: ).
• Evaluating Option 4: Imports by France from India:
• Importer = France, Exporter = India.
• From bar chart: Under cluster France, green bar (India) .
• From radar chart: Red line (France) on India spoke .
• Trade Value .
• (Alternate resolution reading: ).
• Comparison and Conclusion:
Under both direct chart reading () and alternate digitized resolution (), Imports by US from France is unambiguously the highest among all four choices.
• Correct Option: Option 1.
Topper Take
• Denominator Sensitivity Trap: A high tariff amount does not necessarily guarantee high trade volume if the tariff rate is also very high. For instance, France collected on India, but because its tariff rate was a staggering , the underlying trade was only . Conversely, US collected on France at a modest , propelling trade volume to .
• The Reciprocal Exporter Inversion Trap: For Option 2 ("Exports by Japan to UK") and Option 3 ("Exports by France to Japan"), unseasoned candidates look at the exporting country's cluster in the bar chart. Remember: tariffs are collected by the importer, so you must look at UK's cluster for Japan's exports, and Japan's cluster for France's exports.
Other questions in this set
- Q1. How much is Japan's export to India worth?
- Q3. What is the trade surplus/trade deficit of India with UK?
- Q4. Among France and UK, who has/have trade surplus(es) with US?
Other Charts questions from other CAT papers
- CAT 2024 Slot 1 DILR Q10
- CAT 2024 Slot 1 DILR Q11
- CAT 2024 Slot 1 DILR Q12
- CAT 2024 Slot 1 DILR Q13
- CAT 2021 Slot 3 DILR Q13
Practise this question with timing, notes and your mistake notebook.
Practise in PrepSoc