CAT 2024 Slot 1 DILR Q12
- Data Interpretation and Logical Reasoning
- Data Interpretation › Other Charts
- Easy
- Multiple choice
- CAT_2024_SLOT1_DILR_Q12
Data set · questions 10–13
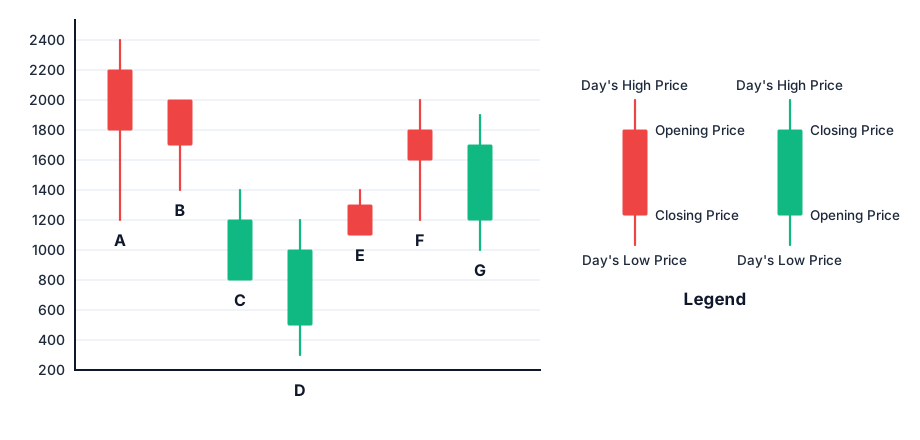
The chart below shows the price data for seven shares- A,B,C,D,E,F, and G as a candlestick plot for a particular day. The vertical axis shows the price of the share in rupees. A share whose closing price (price at the end of the day) is more than its opening price (price at the start of the day) is called a bullish share; otherwise, it is called a bearish share. All bullish and bearish shares are shown in green and red colour respectively.
Question 12
Daily loss for a share is defined as (Opening price - Closing price) / (Opening price). Which among
the shares A, B, F and G had the highest daily loss on that day?
Show answer and solution
Answer: (C)
A
Solution
Concept: Financial Candlestick Analysis & Price Range Deduction
Master State Table
| Share | Candle Color & Trend | Opening Price (₹) | Closing Price (₹) | Day's High (₹) | Day's Low (₹) | Range: High − Low (₹) | Average of Open & Close (₹) | Daily SPV | Daily Loss (%) |
|---|---|---|---|---|---|---|---|---|---|
| A | Bearish (Red) | 2200 | 1800 | 2400 | 1200 | 1200 | 2000 | ||
| B | Bearish (Red) | 2000 | 1700 | 2000 | 1400 | 600 | 1850 | ||
| C | Bullish (Green) | 800 | 1200 | 1400 | 800 | 600 | 1000 | (Gain) | |
| D | Bullish (Green) | 500 | 1000 | 1200 | 300 | 900 | 750 | (Gain) | |
| E | Bearish (Red) | 1300 | 1100 | 1400 | 1100 | 300 | 1200 | ||
| F | Bearish (Red) | 1800 | 1600 | 2000 | 1200 | 800 | 1700 | ||
| G | Bullish (Green) | 1200 | 1700 | 1900 | 1000 | 900 | 1450 | (Gain) |
Question Deduction
• Evaluating Share G:
• (Gain; eliminated immediately).
• Evaluating Share F:
• Price Drop
• Base Entry Price
•
• Evaluating Share B:
• Price Drop
• Base Entry Price
•
• Evaluating Share A:
• Price Drop
• Base Entry Price
•
• Fractional Comparison:
• To compare against , cross-multiply or find a common denominator:
• Converting to percentages:
• Conclusion: Share suffered the greatest daily loss at .
• Option Alignment: This corresponds directly to Option 3 (A).
Topper Take
• The Absolute Absolute Movement Trap (Share G Distractor): In Option 1, Share is presented as an intentional trap. Share moved by points, which is larger than Share 's -point move.
• The Denominator Inversion Trap: Candidates often confuse the base price and divide by the closing price instead of the opening price (e.g., computing for ). Loss is always evaluated on capital invested, meaning Opening Price must be the denominator.
Other questions in this set
- Q10. Daily Share Price Variability (SPV) is defined as (Day's high price - Day's low price) /(Average of the opening and…
- Q11. Daily Share Price Variability (SPV) is defined as (Day's high price - Day's low price) /(Average of the opening and…
- Q13. What would have been the percentage wealth gain for a trader, who bought equal numbers of all bullish shares at…
Other Charts questions from other CAT papers
- CAT 2025 Slot 1 DILR Q1
- CAT 2025 Slot 1 DILR Q2
- CAT 2025 Slot 1 DILR Q3
- CAT 2025 Slot 1 DILR Q4
- CAT 2025 Slot 3 DILR Q6
Practise this question with timing, notes and your mistake notebook.
Practise in PrepSoc