CAT 2021 Slot 3 DILR Q13
- Data Interpretation and Logical Reasoning
- Data Interpretation › Other Charts
- Easy
- Multiple choice
- CAT_2021_SLOT3_DILR_Q13
Data set · questions 13–16
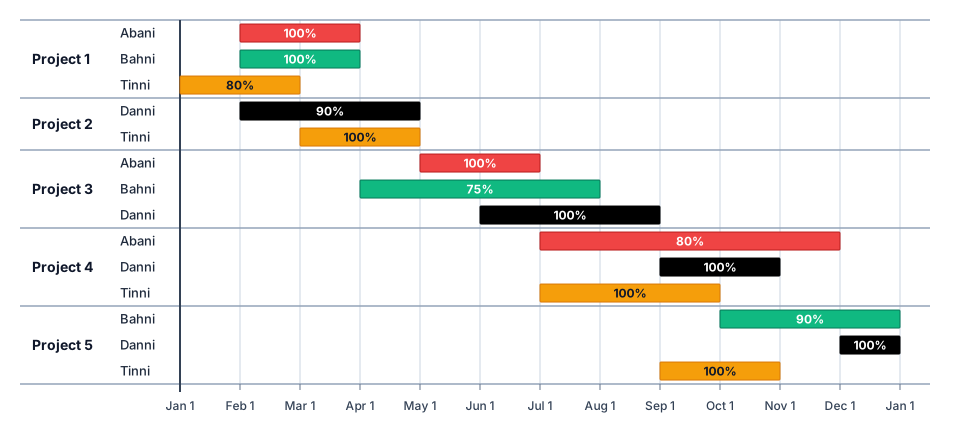
The figure above shows the schedule of four employees – Abani, Bahni, Danni and Tinni –whom Dhoni supervised in 2020. Altogether there were five projects which started and concluded in 2020 in which they were involved. For each of these projects and for each employee, the starting day was at the beginning of a month and the concluding day was the end of a month, and these are indicated by the left and right end points of the corresponding horizontal bars. The number within each bar indicates the percentage of assigned work completed by the employee for that project, as assessed by Dhoni.
For each employee, his/her total project-month (in 2020) is the sum of the number of months(s)he worked across the five project, while his/her annual completion index is the weight age average of the completion percentage assigned from the different projects, with the weights being the corresponding number of months she worked in these projects. For each project, the total employee-month is the sum of the number of months four employees worked in this project, while its completion index is the weight age average of the completion percentage assigned for the employees who worked in this project, with the weights being the corresponding number of months they worked in this project.
Question 13
Which of the following statements is/are true?
I: The total project-month was the same for the four employees.
II: The total employee-month was the same for the five projects.
Show answer and solution
Answer: (B)
Only I
Solution
Concept: Gantt Chart Schedule Analysis, Project-Months & Employee-Months Aggregation
Master State Table
| Project | Active Span | Duration | Abani | Bahni | Danni | Tinni | Total Emp-Mo |
|---|---|---|---|---|---|---|---|
| Project 1 | Jan 1 – Apr 1 | 3 Months | Feb–Apr (2 mo, 100%) | Feb–Apr (2 mo, 100%) | — | Jan–Mar (2 mo, 80%) | 6 Months |
| Project 2 | Feb 1 – May 1 | 3 Months | — | — | Feb–May (3 mo, 90%) | Mar–May (2 mo, 100%) | 5 Months |
| Project 3 | Apr 1 – Sep 1 | 5 Months | May–Jul (2 mo, 100%) | Apr–Aug (4 mo, 75%) | Jun–Sep (3 mo, 100%) | — | 9 Months |
| Project 4 | Jul 1 – Dec 1 | 5 Months | Jul–Dec (5 mo, 80%) | — | Sep–Nov (2 mo, 100%) | Jul–Oct (3 mo, 100%) | 10 Months |
| Project 5 | Sep 1 – Jan 1 | 4 Months | — | Oct–Jan (3 mo, 90%) | Dec–Jan (1 mo, 100%) | Sep–Nov (2 mo, 100%) | 6 Months |
| Total Project-Months | — | — | 9 Months | 9 Months | 9 Months | 9 Months | 36 Months |
| Annual Completion Index | — | — | 88.89% | 85.56% | 96.67% | 95.56% | — |
Question Deduction
• Understanding Metric Definitions:
• Total project-month for an employee is the sum of months worked across all five projects in 2020.
• Total employee-month for a project is the sum of months worked by all four employees on that project.
• Evaluating Statement I (Total Project-Months per Employee):
• Calculate total project-months worked by each employee across 2020:
• Abani: $P_1 (2) + P_3 (2) + P_4 (5) = 9$ months.

• Bahni: $P_1 (2) + P_3 (4) + P_5 (3) = 9$ months.

• Danni: $P_2 (3) + P_3 (3) + P_4 (2) + P_5 (1) = 9$ months.

• Tinni: $P_1 (2) + P_2 (2) + P_4 (3) + P_5 (2) = 9$ months.
• All four employees worked exactly 9 project-months in 2020. Statement I is TRUE.
• Evaluating Statement II (Total Employee-Months per Project):
• Calculate total employee-months contributed to each project:
• Project 1: Abani (2) + Bahni (2) + Tinni (2) $= 6$ employee-months.

• Project 2: Danni (3) + Tinni (2) $= 5$ employee-months.

• Project 3: Abani (2) + Bahni (4) + Danni (3) $= 9$ employee-months.

• Project 4: Abani (5) + Danni (2) + Tinni (3) $= 10$ employee-months.

• Project 5: Bahni (3) + Danni (1) + Tinni (2) $= 6$ employee-months.
• The employee-month totals across projects are and , which are not all identical. Statement II is FALSE.
• Option Matching / Numerical Answer:
• Statement I is true and Statement II is false Matches Option 2 (Only I).
Topper Take
• Fast Verification: Statement I is an instant uniform sum ( months for all four). Disproving Statement II requires checking just two projects ( vs ), locking Option 2 in under 45 seconds.
Other questions in this set
- Q14. Which employees did not work in multiple projects for any of the months in 2020?
- Q15. The project duration, measured in terms of the number of months, is the time duringwhich at least one employee worked…
- Q16. The list of employees in decreasing order of annual completion index is:
Other Charts questions from other CAT papers
- CAT 2025 Slot 1 DILR Q1
- CAT 2025 Slot 1 DILR Q2
- CAT 2025 Slot 1 DILR Q3
- CAT 2025 Slot 1 DILR Q4
- CAT 2025 Slot 3 DILR Q6
Practise this question with timing, notes and your mistake notebook.
Practise in PrepSoc