CAT 2024 Slot 1 DILR Q11
- Data Interpretation and Logical Reasoning
- Data Interpretation › Other Charts
- Easy
- Type in the answer (TITA)
- CAT_2024_SLOT1_DILR_Q11
Data set · questions 10–13
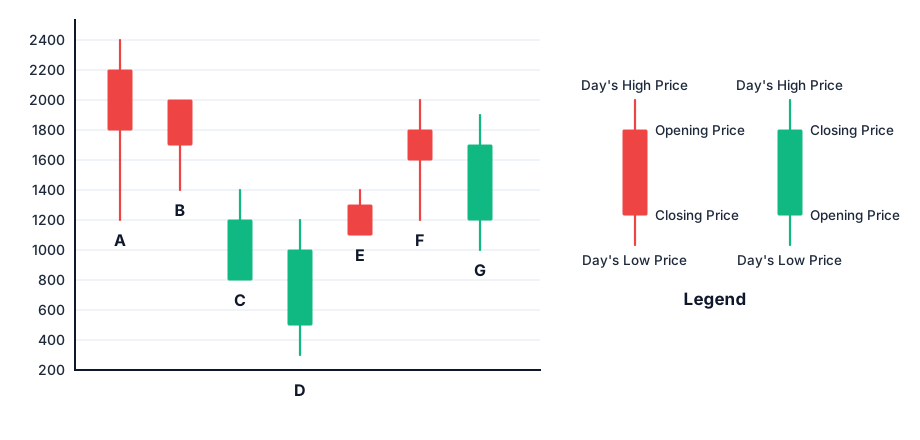
The chart below shows the price data for seven shares- A,B,C,D,E,F, and G as a candlestick plot for a particular day. The vertical axis shows the price of the share in rupees. A share whose closing price (price at the end of the day) is more than its opening price (price at the start of the day) is called a bullish share; otherwise, it is called a bearish share. All bullish and bearish shares are shown in green and red colour respectively.
Question 11
Daily Share Price Variability (SPV) is defined as (Day's high price - Day's low price) /(Average of the opening and closing prices during the day). How many shares had an SPV greater than 0.5 on that day?
Type-in-the-answer (TITA) question: no options are given; enter the value.
Show answer and solution
Answer:
4
Solution
Concept: Financial Candlestick Analysis & Price Range Deduction
Master State Table
| Share | Candle Color & Trend | Opening Price (₹) | Closing Price (₹) | Day's High (₹) | Day's Low (₹) | Range: High − Low (₹) | Average of Open & Close (₹) | Daily SPV | Daily Loss (%) |
|---|---|---|---|---|---|---|---|---|---|
| A | Bearish (Red) | 2200 | 1800 | 2400 | 1200 | 1200 | 2000 | ||
| B | Bearish (Red) | 2000 | 1700 | 2000 | 1400 | 600 | 1850 | ||
| C | Bullish (Green) | 800 | 1200 | 1400 | 800 | 600 | 1000 | (Gain) | |
| D | Bullish (Green) | 500 | 1000 | 1200 | 300 | 900 | 750 | (Gain) | |
| E | Bearish (Red) | 1300 | 1100 | 1400 | 1100 | 300 | 1200 | ||
| F | Bearish (Red) | 1800 | 1600 | 2000 | 1200 | 800 | 1700 | ||
| G | Bullish (Green) | 1200 | 1700 | 1900 | 1000 | 900 | 1450 | (Gain) |
Question Deduction
• Testing Share A:
• Spread
• Midpoint Average
• Since , Qualifies as first qualifying share.
• Testing Share B:
• Spread
• Midpoint Average
• Since , Fails threshold.
• Testing Share C:
• Spread
• Midpoint Average
• Since , Qualifies as second qualifying share.
• Testing Share D:
• Spread
• Midpoint Average
• Since , Qualifies as third qualifying share.
• Testing Share E:
• Spread
• Midpoint Average
• Since , Fails threshold.
• Testing Share F:
• Spread
• Midpoint Average
• Since , Fails threshold.
• Testing Share G:
• Spread
• Midpoint Average
• Since , Qualifies as fourth qualifying share.
• Final Aggregation: Exactly 4 shares (, , , and ) satisfy the condition .
• TITA Input Confirmation: The correct numerical entry is 4.
Topper Take
• The Share F Borderline Trap: Share has a price spread of and a midpoint price of . Because , test-takers who mistakenly use the closing price () as the denominator conclude that (or round up to qualify it), leading to an erroneous count of .
• Reusing Previous Deductions: A high-scoring candidate never restarts calculations from scratch. Question 1 already proved that (), (), and () qualify, while () does not.
Other questions in this set
- Q10. Daily Share Price Variability (SPV) is defined as (Day's high price - Day's low price) /(Average of the opening and…
- Q12. Daily loss for a share is defined as (Opening price - Closing price) / (Opening price). Which among the shares A, B, F…
- Q13. What would have been the percentage wealth gain for a trader, who bought equal numbers of all bullish shares at…
Other Charts questions from other CAT papers
- CAT 2025 Slot 1 DILR Q1
- CAT 2025 Slot 1 DILR Q2
- CAT 2025 Slot 1 DILR Q3
- CAT 2025 Slot 1 DILR Q4
- CAT 2025 Slot 3 DILR Q6
Practise this question with timing, notes and your mistake notebook.
Practise in PrepSoc