CAT 2021 Slot 2 DILR Q4
- Data Interpretation and Logical Reasoning
- Data Interpretation › Bar Graphs
- Easy
- Multiple choice
- CAT_2021_SLOT2_DILR_Q04
Data set · questions 1–4
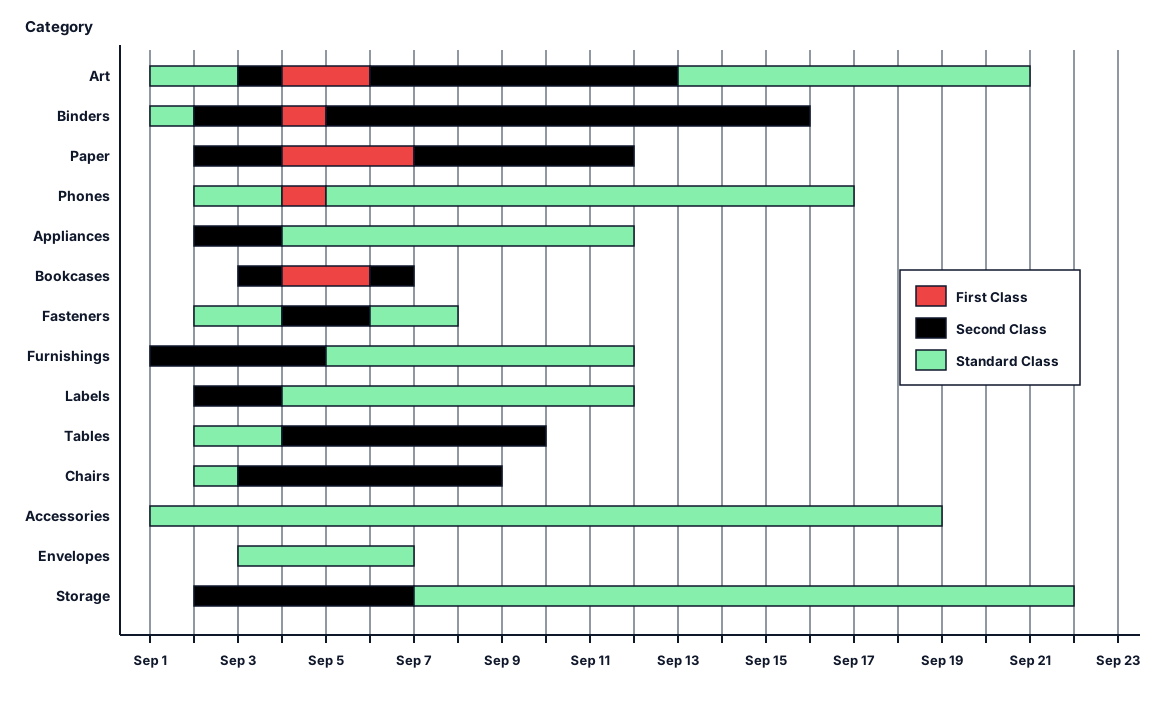
The different bars in the diagram above provide information about different orders in various categories (Art, Binders, ....) that were booked in the first two weeks of September of a store for one client. The colour and pattern of a bar denotes the ship mode (First Class / Second Class / Standard Class). The left end point of a bar indicates the booking day of the order, while the right end point indicates the dispatch day of the order. The difference between the dispatch day and the booking day (measured in terms of the number of days) is called the processing time of the order.
For the same category, an order is considered for booking only after the previous order of the same category is dispatched. No two consecutive orders of the same category had identical ship mode during this period.
For example, there were only two orders in the furnishing category during this period. The first one was shipped in the Second Class. It was booked on Sep 1 and dispatched on Sep 5. The second order was shipped in the Standard class. It was booked on Sep 5 (although the order might have been placed before that) and dispatched on Sep 12. So the processing times were 4 and 7 days respectively for these orders.
Question 4
Approximately what percentage of orders had a processing time of one day during the period Sep 1 to Sep 22 (both dates inclusive)?
Show answer and solution
Answer: (C)
20%
Solution
Concept: Duration-Length Filtering, Cardinality Census & Percentage Distribution
Master State Table
| Category | Standard Class (Booked–Dispatched) | First Class (Booked–Dispatched) | Second Class (Booked–Dispatched) | Total Orders | Total Days |
|---|---|---|---|---|---|
| Accessories | Sep 1–19 (18d) | — | — | 1 | 18 |
| Appliances | Sep 4–12 (8d) | — | Sep 2–4 (2d) | 2 | 10 |
| Art | Sep 1–3 (2d), Sep 13–21 (8d) | Sep 4–6 (2d) | Sep 3–4 (1d), Sep 6–13 (7d) | 5 | 20 |
| Binders | Sep 1–2 (1d), Sep 4–5 (1d) | Sep 2–4 (2d) | Sep 5–16 (11d) | 4 | 15 |
| Bookcases | — | Sep 4–6 (2d) | Sep 3–4 (1d), Sep 6–7 (1d) | 3 | 4 |
| Chairs | Sep 2–3 (1d) | — | Sep 3–9 (6d) | 2 | 7 |
| Envelopes | Sep 3–7 (4d) | — | — | 1 | 4 |
| Fasteners | Sep 2–4 (2d), Sep 6–8 (2d) | — | Sep 4–6 (2d) | 3 | 6 |
| Furnishings | Sep 5–12 (7d) | — | Sep 1–5 (4d) | 2 | 11 |
| Labels | Sep 4–12 (8d) | — | Sep 1–3 (2d) | 2 | 10 |
| Paper | — | Sep 4–7 (3d) | Sep 2–4 (2d), Sep 7–12 (5d) | 3 | 10 |
| Phones | Sep 2–4 (2d), Sep 5–17 (12d) | Sep 4–5 (1d) | — | 3 | 15 |
| Storage | Sep 7–22 (15d) | — | Sep 2–7 (5d) | 2 | 20 |
| Tables | Sep 2–4 (2d) | — | Sep 4–10 (6d) | 2 | 8 |
| Total | 17 Orders | 5 Orders | 13 Orders | 35 | 148 |
Question Deduction
• Target Metric & Scope:
• Scope: All 35 orders across 14 categories (Sep 1–22).
• Target: Orders with processing time of 1 day ().
• Formula:
$$\text{Percentage} = \frac{N_{1\text{-day}}}{N_{\text{total}}} \times 100\%$$
• Census of Total Orders ():
• Summing orders across all 14 categories from the Master State Table:
$$N_{\text{total}} = 1 + 2 + 5 + 4 + 3 + 2 + 1 + 3 + 2 + 2 + 3 + 3 + 2 + 2 = 35\text{ orders}$$
• Enumeration of One-Day Orders ():
• Locating orders with duration of 1 day:
• **Art**: Sep 3 $\to$ Sep 4 ($1$ day).

• **Binders**: Sep 1 $\to$ Sep 2 and Sep 4 $\to$ Sep 5 ($2$ orders).

• **Bookcases**: Sep 3 $\to$ Sep 4 and Sep 6 $\to$ Sep 7 ($2$ orders).

• **Chairs**: Sep 2 $\to$ Sep 3 ($1$ day).

• **Phones**: Sep 4 $\to$ Sep 5 ($1$ day).
• All remaining 28 orders span days (up to 18 days).
• Total count of 1-day orders: .
• Calculating the Percentage:
• Computing the required ratio:
$$\text{Percentage} = \frac{7}{35} \times 100\% = \frac{1}{5} \times 100\% = 20\%$$
• Option Matching:
• Matches Option 3 (20%).
Topper Take
• Fraction Recognition: Scan bars of unit width (duration ). Exactly 7 such orders exist out of 35 total orders. locks Option 3 immediately.
Other questions in this set
- Q1. How many days between Sep 1 and Sep 14 (both inclusive) had no booking from this client considering all the above…
- Q2. What was the average processing time of all orders in the categories which had only one type of ship mode?
- Q3. The sequence of categories Art, Binders, Paper and Phones in decreasing order of average processing time of their…
Bar Graphs questions from other CAT papers
- CAT 2025 Slot 2 DILR Q15
- CAT 2025 Slot 2 DILR Q16
- CAT 2025 Slot 2 DILR Q17
- CAT 2025 Slot 2 DILR Q18
- CAT 2024 Slot 1 DILR Q14
Practise this question with timing, notes and your mistake notebook.
Practise in PrepSoc