CAT 2024 Slot 3 DILR Q6
- Data Interpretation and Logical Reasoning
- Data Interpretation › Bar Graphs
- Easy
- Multiple choice
- CAT_2024_SLOT3_DILR_Q06
Data set · questions 6–9
Over the top (OTT) subscribers of a platform are segregated into three categories:
i) Kid, ii) Elder, and iii) Others.
Some of the subscribers used one app and the others used multiple apps to access the platform. The figure below shows a bar graph representing the percentage of the total number of subscribers in 2023 and 2024 who belong to the 'Kid' and 'Elder' categories.
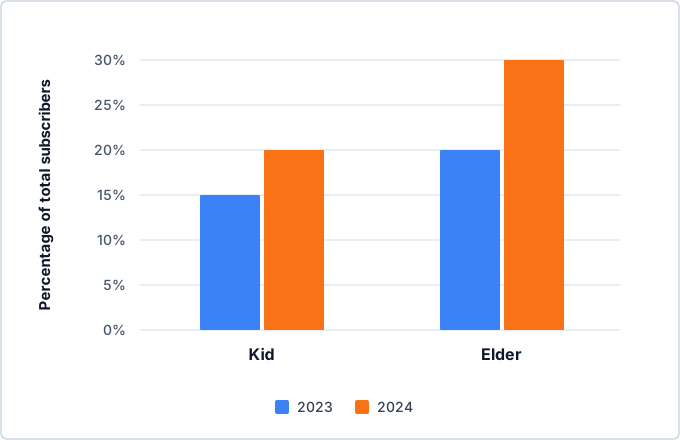
The following additional facts are known about the number of subscribers.
- The total number of subscribers increased by 10% from 2023 to 2024.
- In 2024, 1/2 of the subscribers from the ‘Kid' category and 2/3 of the subscribers from the 'Elder' category subscribers use one app.
- In 2023, the number of subscribers from the 'Kid' category who used multiple apps was the same as the number of subscribers from the 'Elder' category who used one app.
- 10,000 subscribers from the 'Kid' category used one app and 15,000 subscribers from the 'Elder' category used multiple apps in 2023.
Question 6
How many subscribers belonged to the ‘Others' category in 2024?
Show answer and solution
Answer: (B)
55000
Solution
Concept: Demographic Partitions & OTT Application Usage
Master State Table
Category Population Distribution (2023 vs 2024)
| Category | 2023 Share (%) | 2023 Subscribers | 2024 Share (%) | 2024 Subscribers | Absolute Growth |
|---|---|---|---|---|---|
| Kid | 15,000 | 22,000 | () | ||
| Elder | 20,000 | 33,000 | () | ||
| Others | 65,000 | 55,000 | () | ||
| Total Platform | 100,000 | 110,000 | () |
Application Usage Architecture (One App vs Multiple Apps)
| Category | 2023 One-App | 2023 Multi-App | 2024 One-App | 2024 Multi-App |
|---|---|---|---|---|
| Kid | 10,000 | 5,000 | 11,000 | 11,000 |
| Elder | 5,000 | 15,000 | 22,000 | 11,000 |
| Others | (bounded) | |||
| Total Platform | — | — |
Question Deduction
We need to find the total number of subscribers belonging to the 'Others' category in 2024.
• Algebraic Derivations of Total Platform Base:
• Let the total subscriber base in 2023 be .
• With a platform growth from 2023 to 2024 (Clue 1), the total base in 2024 is:
• Category percentages from the chart:
• 2023: , , .
• 2024: , , .
• Solving for Base Parameter via Clues 2, 3, and 4:
• In 2024 (Clue 2):
• Kid One-App Kid Multi-App .
• Elder One-App Elder Multi-App .
• In 2023 (Clues 3 & 4):
• Kid One-App (given).
• Elder Multi-App (given).
• Kid Multi-App Elder One-App (given equal).
• Equating category sums in 2023:
• Subtracting the two equations:
• Calculating Others in 2024:
Therefore, the number of subscribers in the 'Others' category in 2024 was 55000 (Option 2).
Topper Take
• Direct Difference Elimination: Subtracting the two demographic equations cancels immediately, yielding . Once is known, of gives in 5 seconds.
Other questions in this set
- Q7. What percentage of subscribers in the ‘Kid’ category used multiple apps in 2023?
- Q8. What was the percentage increase in the number of subscribers in the ‘Elder’ category from 2023 to 2024?
- Q9. What could be the minimum percentage of subscribers who used multiple apps in2024?
Bar Graphs questions from other CAT papers
- CAT 2025 Slot 2 DILR Q15
- CAT 2025 Slot 2 DILR Q16
- CAT 2025 Slot 2 DILR Q17
- CAT 2025 Slot 2 DILR Q18
- CAT 2022 Slot 3 DILR Q6
Practise this question with timing, notes and your mistake notebook.
Practise in PrepSoc