CAT 2022 Slot 3 DILR Q7
- Data Interpretation and Logical Reasoning
- Data Interpretation › Bar Graphs
- Easy
- Multiple choice
- CAT_2022_SLOT3_DILR_Q07
Data set · questions 6–10
In the following, a year corresponds to 1st of January of that year.
A study to determine the mortality rate for a disease began in 1980. The study chose 1000 males and 1000 females and followed them for forty years or until they died, whichever came first. The 1000 males chosen in 1980 consisted of 250 each of ages 10 to less than 20, 20 to less than 30, 30 to less than 40, and 40 to less than 50. The 1000 females chosen in 1980 also consisted of 250 each of ages 10 to less than 20, 20 to less than 30, 30 to less than 40, and 40 to less than 50.
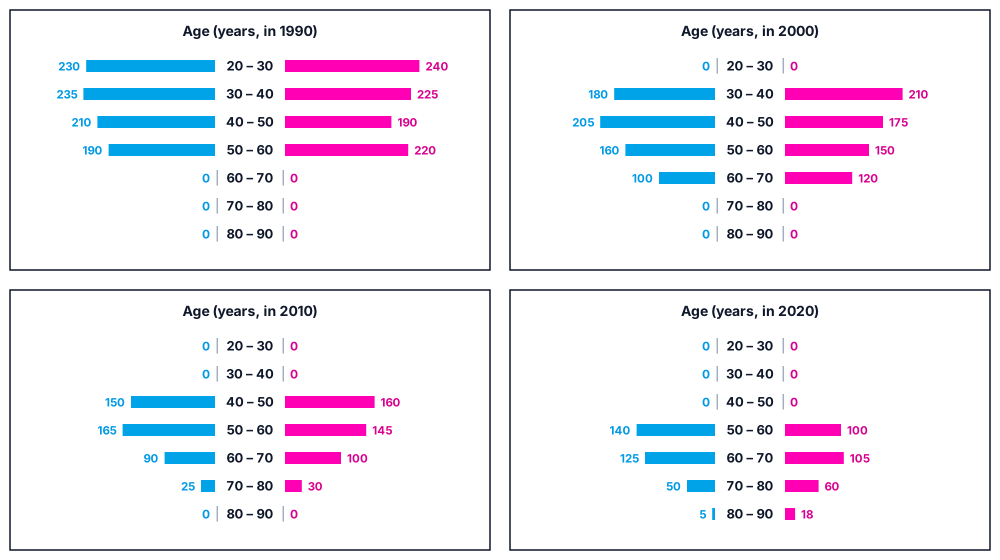
The four figures below depict the age profile of those among the 2000 individuals who were still alive in 1990, 2000, 2010, and 2020. The blue bars in each figure represent the number of males in each age group at that point in time, while the pink bars represent the number of females in each age group at that point in time. The numbers next to the bars give the exact numbers being represented by the bars. For example, we know that 230 males among those tracked and who were alive in 1990 were aged between 20 and 30.
Question 7
How many people who were being tracked and who were between 30 and 40 years of age in 1980 survived until 2010?
Show answer and solution
Answer: (A)
190
Solution
Concept: Cohort Longitudinal Tracking, Survival Filtering & Ratio Verification
Master State Table
| Initial Age Bracket (in 1980) | Gender | 1980 (Start) | 1990 (Alive) | 2000 (Alive) | 2010 (Alive) | 2020 (Alive) |
|---|---|---|---|---|---|---|
| 10 to <20 | Male | 250 | 230 | 180 | 150 | 140 |
| 10 to <20 | Female | 250 | 240 | 210 | 160 | 100 |
| 20 to <30 | Male | 250 | 235 | 205 | 165 | 125 |
| 20 to <30 | Female | 250 | 225 | 175 | 145 | 105 |
| 30 to <40 | Male | 250 | 210 | 160 | 90 | 50 |
| 30 to <40 | Female | 250 | 190 | 150 | 100 | 60 |
| 40 to <50 | Male | 250 | 190 | 100 | 25 | 5 |
| 40 to <50 | Female | 250 | 220 | 120 | 30 | 18 |
| Total Alive | Males | 1,000 | 865 | 645 | 430 | 320 |
| Total Alive | Females | 1,000 | 875 | 655 | 435 | 283 |
Question Deduction
• Targeting the 30 to <40 Cohort from 1980:
• Individuals aged between 30 and 40 in 1980 start with 250 males and 250 females.
• Track their survival across 3 decades to 2010 (when they are aged 60 to <70):
• **Males Surviving to 2010**:

  • Reading from chart for age group 60 to <70 in 2010: exactly 90 males.

• **Females Surviving to 2010**:

  • Reading from chart for age group 60 to <70 in 2010: exactly 100 females.
• Summing Total Survivors:
• Option Matching:
• Matches Option 1 (190).
Topper Take
• Cohort Tracking: Look at the 30–40 cohort in 2010 (now aged 60–70). Male survivors , female survivors . Sum .
Other questions in this set
- Q6. In 2000, what was the ratio of the number of dead males to dead females among those being tracked?
- Q8. How many individuals who were being tracked and who were less than 30 years of age in 1980 survived until 2020?
- Q9. How many of the males who were being tracked and who were between 20 and 30 years of age in 1980 died in the period…
- Q10. How many of the females who were being tracked and who were between 20 and 30 years of age in 1980 died between the…
Bar Graphs questions from other CAT papers
- CAT 2025 Slot 2 DILR Q15
- CAT 2025 Slot 2 DILR Q16
- CAT 2025 Slot 2 DILR Q17
- CAT 2025 Slot 2 DILR Q18
- CAT 2024 Slot 1 DILR Q14
Practise this question with timing, notes and your mistake notebook.
Practise in PrepSoc