CAT 2021 Slot 1 DILR Q4
- Data Interpretation and Logical Reasoning
- Data Interpretation › Bar Graphs
- Easy
- Multiple choice
- CAT_2021_SLOT1_DILR_Q04
Data set · questions 1–4
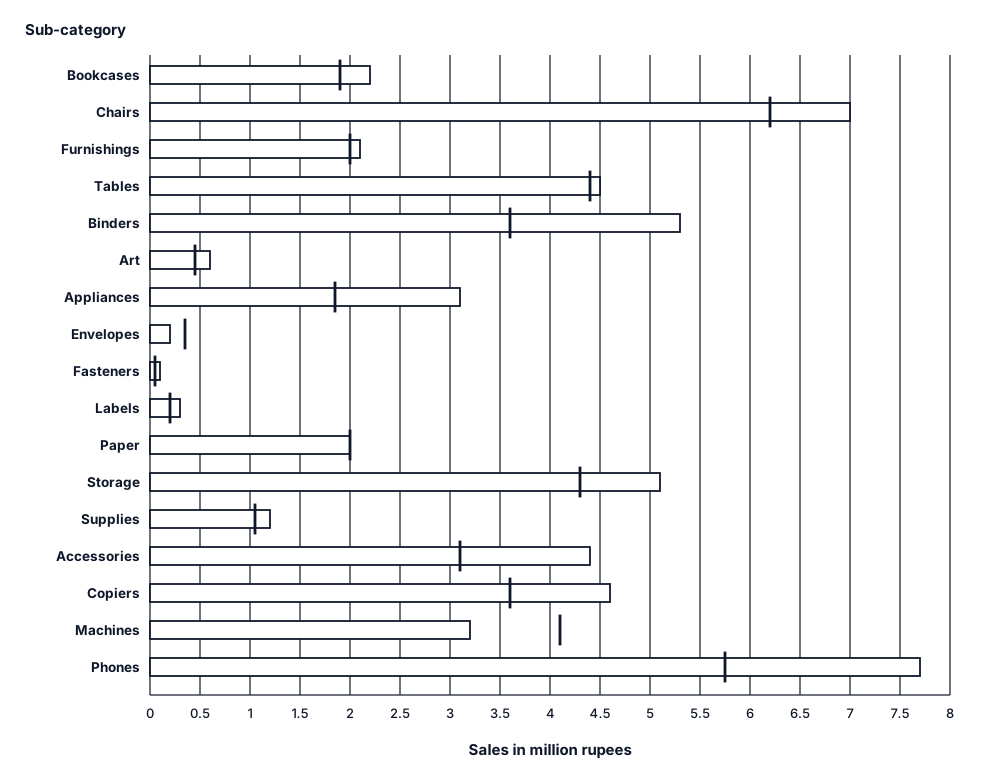
The horizontal bars in the above diagram represent 2020 aggregate sales (in million ₹) of accompany for the different subcategories of its products. The top four product subcategories (Bookcases, Chairs, Furnishings, Tables) belong to furniture product category; the bottom four product subcategories (Accessories, Copiers, Machines, Phones) belong to the technology product category while all other product subcategories belong to the office supply product category. For each of the product subcategories, there is a vertical line indicating the sales of the corresponding subcategory in 2019.
Question 4
The improvement index for a category is the maximum percentage increase in sales from 2019 to 2020 among any of its subcategories. The correct order of categories in increasing order of this improvement index is
Show answer and solution
Answer: (D)
furniture, technology, office supply
Solution
Concept: Peak Growth Metric Identification & Category Ranking
Master State Table
| Category | Subcategory | 2019 (₹M) | 2020 (₹M) | Change (₹M) | Growth (%) |
|---|---|---|---|---|---|
| Furniture | Bookcases | 1.90 | 2.20 | +0.30 | +15.8% |
| Furniture | Chairs | 6.20 | 7.00 | +0.80 | +12.9% |
| Furniture | Furnishings | 2.05 | 2.10 | +0.05 | +2.4% |
| Furniture | Tables | 4.40 | 4.50 | +0.10 | +2.3% |
| Office Supplies | Binders | 3.60 | 5.30 | +1.70 | +47.2% |
| Office Supplies | Art | 0.40 | 0.60 | +0.20 | +50.0% |
| Office Supplies | Appliances | 1.90 | 3.10 | +1.20 | +63.2% |
| Office Supplies | Envelopes | 0.35 | 0.20 | -0.15 | -42.9% |
| Office Supplies | Fasteners | 0.10 | 0.10 | 0.00 | 0.0% |
| Office Supplies | Labels | 0.20 | 0.30 | +0.10 | +50.0% |
| Office Supplies | Paper | 1.50 | 2.00 | +0.50 | +33.3% |
| Office Supplies | Storage | 4.30 | 5.10 | +0.80 | +18.6% |
| Office Supplies | Supplies | 1.10 | 1.20 | +0.10 | +9.1% |
| Technology | Accessories | 3.10 | 4.40 | +1.30 | +41.9% |
| Technology | Copiers | 3.60 | 4.60 | +1.00 | +27.8% |
| Technology | Machines | 4.10 | 3.20 | -0.90 | -22.0% |
| Technology | Phones | 5.80 | 7.70 | +1.90 | +32.8% |
Question Deduction
• Improvement Index Formulation:
• The improvement index is the peak subcategory percentage growth in category :
$$\text{Improvement Index}(C) = \max_{s \in C} \left( \frac{\text{Sales}_{2020}(s) - \text{Sales}_{2019}(s)}{\text{Sales}_{2019}(s)} \times 100\% \right)$$
• Evaluating Category Peaks:
• Furniture:
• Bookcases: $\frac{2.20 - 1.90}{1.90} \times 100\% \approx 15.8\%$.

• Chairs: $\approx 12.9\%$; Furnishings: $\approx 2.4\%$; Tables: $\approx 2.3\%$.

• Peak Furniture: Bookcases ($\approx 15.8\%$).
• Technology:
• Accessories: $\frac{4.40 - 3.10}{3.10} \times 100\% \approx 41.9\%$.

• Phones: $\approx 32.8\%$; Copiers: $\approx 27.8\%$; Machines: $-22.0\%$.

• Peak Technology: Accessories ($\approx 41.9\%$).
• Office Supply:
• Appliances: $\frac{3.10 - 1.90}{1.90} \times 100\% = \frac{1.20}{1.90} \times 100\% \approx 63.2\%$.

• Binders: $\approx 47.2\%$; Art & Labels: $50.0\%$.

• Peak Office Supply: Appliances ($\approx 63.2\%$).
• Ranking Categories in Increasing Order:
• Comparing peak indices:
$$\text{Furniture } (\approx 15.8\%) < \text{Technology } (\approx 41.9\%) < \text{Office Supply } (\approx 63.2\%)$$
• Strictly increasing order:
$$\text{furniture, technology, office supply}$$
• Option Matching:
• Matches Option 4.
Topper Take
• Max hunter: Scan each block for the largest relative bar-tick extension: Furniture tops at Bookcases (~16%), Technology at Accessories (~42%), and Office Supply at Appliances (~63%). Ordering: Furniture < Technology < Office Supply.
Other questions in this set
- Q1. The total sales (in million ₹) in 2019 from products in office supplies category is closest to
- Q2. The percentage increase in sales in Furniture category from 2019 to 2020 is closest to
- Q3. How many subcategories had sales of ₹ 4 million or more in 2019 and registered an increase in sales in excess of 25%…
Bar Graphs questions from other CAT papers
- CAT 2025 Slot 2 DILR Q15
- CAT 2025 Slot 2 DILR Q16
- CAT 2025 Slot 2 DILR Q17
- CAT 2025 Slot 2 DILR Q18
- CAT 2024 Slot 1 DILR Q14
Practise this question with timing, notes and your mistake notebook.
Practise in PrepSoc