CAT 2018 Slot 1 DILR Q19
- Data Interpretation and Logical Reasoning
- Data Interpretation › Other Charts
- Easy
- Multiple choice
- CAT_2018_SLOT1_DILR_Q19
Data set · questions 17–20
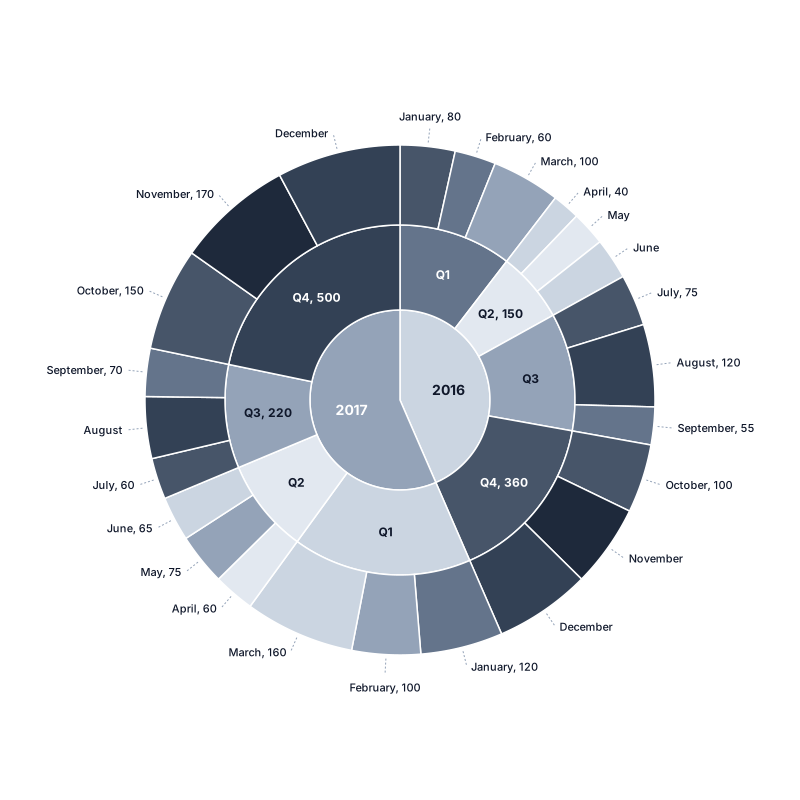
The multi-layered pie-chart below shows the sales of LED television sets for a big retail electronics outlet during 2016 and 2017. The outer layer shows the monthly sales during this period, with each label showing the month followed by sales figure of that month. For some months, the sales figures are not given in the chart. The middle-layer shows quarterwise aggregate sales figures (in some cases, aggregate quarter-wise sales numbers are not given next to the quarter). The innermost layer shows annual sales. It is known that the sales figures during the three months of the second quarter (April, May, June) of 2016 form an arithmetic progression, as do the three monthly sales figures in the fourth quarter (October, November, December) of that year.
Question 19
During which quarter was the percentage decrease in sales from the previous quarter’s sales the highest?
Show answer and solution
Answer: (A)
Q2 of 2017
Solution
Concept: Chronological Sequential Transition, Quarter-over-Quarter Contraction & Benchmark Comparison
Master State Table
| Quarter | Month | 2016 Sales (Units) | 2017 Sales (Units) |
|---|---|---|---|
| Q1 | January | 80 | 120 |
| Q1 | February | 60 | 100 |
| Q1 | March | 100 | 160 |
| Q1 Total | Quarterly Aggregate | 240 | 380 |
| Q2 | April | 40 | 60 |
| Q2 | May | 50 (AP) | 75 |
| Q2 | June | 60 (AP) | 65 |
| Q2 Total | Quarterly Aggregate | 150 | 200 |
| Q3 | July | 75 | 60 |
| Q3 | August | 120 | 90 (Balance) |
| Q3 | September | 55 | 70 |
| Q3 Total | Quarterly Aggregate | 250 | 220 |
| Q4 | October | 100 | 150 |
| Q4 | November | 120 (AP) | 170 |
| Q4 | December | 140 (AP) | 180 (Balance) |
| Q4 Total | Quarterly Aggregate | 360 | 500 |
| Annual Total | Full Year Aggregate | 1,000 | 1,300 |
Question Deduction
• Chronological Transition Mapping Across Quarters:
• Sequential progression of quarterly sales across 2016-2017:
$\text{Q1}_{2016} (240) o \text{Q2}_{2016} (150) o \text{Q3}_{2016} (250) o \text{Q4}_{2016} (360) o \text{Q1}_{2017} (380) o \text{Q2}_{2017} (200) o \text{Q3}_{2017} (220) o \text{Q4}_{2017} (500)$.
• We evaluate consecutive quarterly transitions to find the steepest percentage drop: .
• Option Triage & Distractor Elimination:
• Option 2 (Q4 of 2017): Grew from (0.27%$), eliminated.
• Option 4 (Q1 of 2017): Grew from (0.56%$), eliminated.
• Sales contracted in only two quarters across the timeline: Q2 of 2016 and Q2 of 2017.
• Quantitative Comparison of Decreasing Quarters:
• Q2 of 2016 (Option 3):
• Drop from Q1 2016: $\frac{240 - 150}{240} \times 100\% = \frac{90}{240} \times 100\% = \frac{3}{8} \times 100\% = 37.50\%$.
• Q2 of 2017 (Option 1):
• Drop from Q1 2017: $\frac{380 - 200}{380} \times 100\% = \frac{180}{380} \times 100\% = \frac{9}{19} \times 100\% \approx 47.37\%$.
• Comparison: .
• Option Matching / Numerical Answer:
• Q2 of 2017 recorded the steepest contraction (.37%$).
• Option 3 (.50%$) is lower; Options 2 and 4 represent sales increases.
• Confirms Option 1 as the correct choice.
Topper Take
• Instantly eliminate Options 2 and 4 as sales expanded from their preceding quarters ( o 380).
• Benchmark the remaining pair against %), whereas \frac{90}{240} = 37.5% sits far below. Mental triage solves this in 15 seconds.
Other questions in this set
- Q17. What is the percentage increase in sales in December 2017 as compared to the sales in December 2016?
- Q18. In which quarter of 2017 was the percentage increase in sales from the same quarter of 2016 the highest?
- Q20. During which month was the percentage increase in sales from the previous month’s sales the highest?
Other Charts questions from other CAT papers
- CAT 2025 Slot 1 DILR Q1
- CAT 2025 Slot 1 DILR Q2
- CAT 2025 Slot 1 DILR Q3
- CAT 2025 Slot 1 DILR Q4
- CAT 2025 Slot 3 DILR Q6
Practise this question with timing, notes and your mistake notebook.
Practise in PrepSoc