CAT 2018 Slot 2 DILR Q21
- Data Interpretation and Logical Reasoning
- Logical Reasoning › Grids
- Hard
- Multiple choice
- CAT_2018_SLOT2_DILR_Q21
Data set · questions 21–24
Each of the 23 boxes in the picture below represents a product manufactured by one of the following three companies: Alfa, Bravo and Charlie. The area of a box is proportional to the revenue from the corresponding product, while its centre represents the Product popularity and Market potential scores of the product (out of 20). The shadings of some of the boxes have got erased.
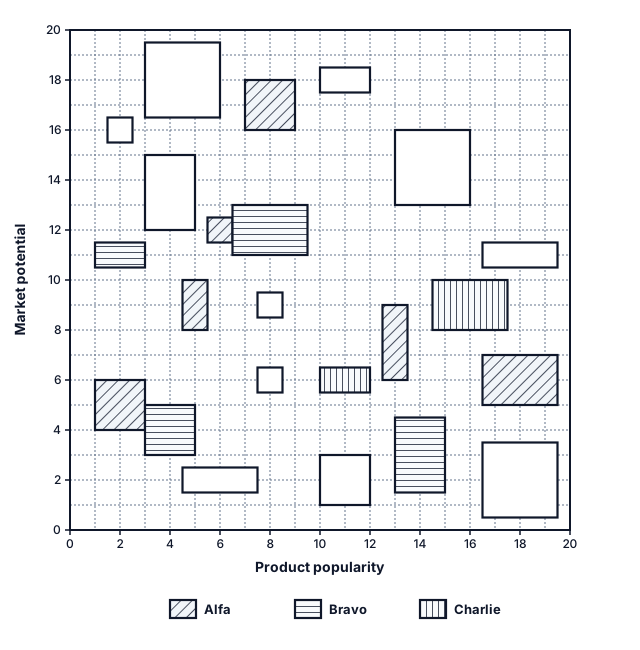
The companies classified their products into four categories based on a combination of scores (out of 20) on the two parameters - Product popularity and Market potential as given below:
| Promising | Blockbuster | Doubtful | No-hope | |
|---|---|---|---|---|
| Product popularity score | > 10 | > 10 | ≤ 10 | ≤ 10 |
| Market potential score | > 10 | ≤ 10 | > 10 | ≤ 10 |
The following facts are known:
- Alfa and Bravo had the same number of products in the Blockbuster category.
- Charlie had more products than Bravo but fewer products than Alfa in the No-hope category.
- Each company had an equal number of products in the Promising category.
- Charlie did not have any product in the Doubtful category, while Alfa had one product more than Bravo in this category.
- Bravo had a higher revenue than Alfa from products in the Doubtful category.
- Charlie had a higher revenue than Bravo from products in the Blockbuster category.
- Bravo and Charlie had the same revenue from products in the No-hope category.
- Alfa and Charlie had the same total revenue considering all products.
Question 21
Considering all companies' products, which product category had the highest revenue?
Show answer and solution
Answer: (A)
Blockbuster
Solution
Concept: Coordinate Boundary Partitioning, Box Geometric Revenue Integration & Quadrant Revenue Dominance
Master State Table
| Category | Definition (Popularity, Potential) | Alfa Products & Sizes | Bravo Products & Sizes | Charlie Products & Sizes | Total Products | Alfa Revenue | Bravo Revenue | Charlie Revenue | Category Revenue |
|---|---|---|---|---|---|---|---|---|---|
| Promising | Popularity , Potential | 1 () | 1 () | 1 () | 3 | 2 | 3 | 9 | 14 |
| Blockbuster | Popularity , Potential | 2 () | 2 () | 3 () | 7 | 9 | 10 | 17 | 36 |
| Doubtful | Popularity , Potential | 4 () | 3 () | 0 (—) | 7 | 12 | 17 | 0 | 29 |
| No-hope | Popularity , Potential | 3 () | 1 () | 2 () | 6 | 7 | 4 | 4 | 15 |
| Total | All 23 Products | 10 Products | 7 Products | 6 Products | 23 | 30 | 34 | 30 | 94 |
Question Deduction
• Coordinate Plane & Quadrant Setup:
• The grid plots Product Popularity (-axis) and Market Potential (-axis), partitioned at score by box centers:
• **Promising**: Popularity $> 10$, Potential $> 10$ (Top-Right).

• **Blockbuster**: Popularity $> 10$, Potential $\le 10$ (Bottom-Right).

• **Doubtful**: Popularity $\le 10$, Potential $> 10$ (Top-Left).

• **No-hope**: Popularity $\le 10$, Potential $\le 10$ (Bottom-Left).
• Area-Proportional Revenue Formulation:
• Revenue is proportional to box area (width height in unit squares).
• For system-wide category totals, individual company assignments do not alter quadrant sums.
• Quadrant Revenue Aggregation:
• Promising (3 boxes): .
• Doubtful (7 boxes): .
• No-hope (6 boxes): .
• Blockbuster (7 boxes): .
• Comparative Ranking & Category Maximization:
• Ranking categories by total revenue:
$$\text{Blockbuster } (36) > \text{Doubtful } (29) > \text{No-hope } (15) > \text{Promising } (14)$$
• Blockbuster generates the maximum revenue (), anchored by four major products of sizes and .
• Option Matching / Numerical Answer:
• Matches Option 1 ("Blockbuster").
• Distractors fail: Doubtful (), No-hope (), and Promising () generate strictly lower revenue.
Topper Take
• Aggregation bypass: The query spans all companies combined, eliminating any need to resolve erased shadings!
• Direct visual summation confirms Blockbuster () dominates Doubtful () in under 30 seconds.
Other questions in this set
- Q22. Which of the following statements is NOT correct?
- Q23. Which of the following is the correct sequence of numbers of products Bravo had in No-hope, Doubtful, Promising and…
- Q24. If the smallest box on the grid is equivalent to revenue of Rs.1 crore, then what approximately was the total revenue…
Grids questions from other CAT papers
- CAT 2025 Slot 2 DILR Q6
- CAT 2025 Slot 2 DILR Q7
- CAT 2025 Slot 2 DILR Q8
- CAT 2025 Slot 2 DILR Q9
- CAT 2025 Slot 3 DILR Q10
Practise this question with timing, notes and your mistake notebook.
Practise in PrepSoc