Practice Exercise 1 (53 Questions)
Practice Exercise 1 tests multidimensional combinational data interpretation, integrating multi-axis line graphs, multi-tier bar charts, dual-doughnut distributions, and complex parametric payoff matrices. Candidates must master cross-chart variable linking, Diophantine integer optimization, network routing, and dominance criteria.
Combinational Graphs & Multi-Modal Data Sets
Combinational graphs in CAT and IPMAT represent the pinnacle of data interpretation complexity. Rather than analyzing an isolated chart, problems link multiple heterogeneous representations together:
-
Tables & Multi-Axis Line Charts: Often combine financial/tariff data with physical volume/workload metrics to determine unit rates, marginal growth, and weighted averages.
-
Donut Charts & Sectoral Distribution: Bridge macro-level sovereign/portfolio allocations to micro-level equity/project payoffs.
-
Network Routing & Optimization: Combine physical node-segment distances with non-linear piecewise tariff schedules.
-
Dominance & Payoff Matrices: Analyze Pareto efficiency, game-theoretic best responses, and strategic advantage under asymmetric information.
-
Integer Optimization (Diophantine Systems): Solve bounded integer problems with weighted averages across categorical staff levels.
Practice questions
Question 1 · Foundation
Directions for Questions 1 to 4
Answer the questions on the basis of the information given below.
Four hyperscale enterprise cloud AI compute clusters—Cluster A, Cluster B, Cluster C, and Cluster D—provide high-throughput GPU model training and burst inference blocks to enterprise clients.
The table below provides the Burst Ingestion Tariff (in Rs. per GPU-Hour processing block) across the 2021–2023 period:
| Cluster | 2021 | 2022 | 2023 |
|---|---|---|---|
| Cluster A | 120000 | 150000 | 180000 |
| Cluster B | 180000 | 210000 | 250000 |
| Cluster C | 150000 | 180000 | 225000 |
| Cluster D | 90000 | 120000 | 160000 |
The bar chart below illustrates the Active Concurrent Enterprise Workloads (in thousands) deployed on each of the four clusters over the same three-year window:
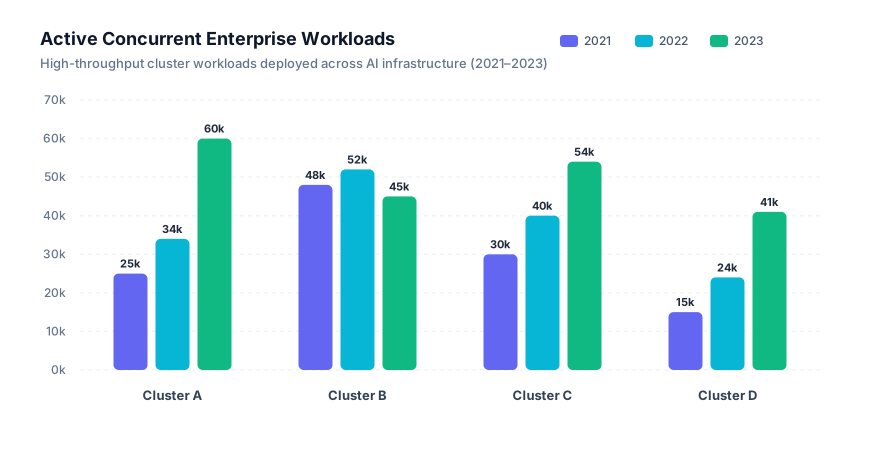
Had Cluster A witnessed the same growth rate in its active concurrent workloads during the period 2021–2023 as that witnessed by Cluster C during the same period, by what percentage would its active workloads in 2023 have been less than its actual active workloads in that year?
Show answer and explanation
Answer: (B) 25%
Step-by-Step Solution:
-
Calculate the Growth Rate of Cluster C (2021–2023):
-
From the chart, active workloads for Cluster C:
-
In 2021: workloads
-
In 2023: workloads
-
-
-
Determine the Hypothetical 2023 Workloads for Cluster A:
-
Actual workloads for Cluster A in 2021 = .
-
If Cluster A had grown at , its hypothetical 2023 workloads would be:
-
-
Compare with Actual 2023 Workloads for Cluster A:
-
Actual workloads for Cluster A in 2023 = .
-
Difference = .
-
Hence, the correct option is 25%.
Question 2 · Foundation
Directions for Questions 1 to 4
Answer the questions on the basis of the information given below.
Four hyperscale enterprise cloud AI compute clusters—Cluster A, Cluster B, Cluster C, and Cluster D—provide high-throughput GPU model training and burst inference blocks to enterprise clients.
The table below provides the Burst Ingestion Tariff (in Rs. per GPU-Hour processing block) across the 2021–2023 period:
| Cluster | 2021 | 2022 | 2023 |
|---|---|---|---|
| Cluster A | 120000 | 150000 | 180000 |
| Cluster B | 180000 | 210000 | 250000 |
| Cluster C | 150000 | 180000 | 225000 |
| Cluster D | 90000 | 120000 | 160000 |
The bar chart below illustrates the Active Concurrent Enterprise Workloads (in thousands) deployed on each of the four clusters over the same three-year window:
In 2021, which cluster had the highest burst ingestion tariff per active concurrent workload instance?
Show answer and explanation
Answer: (C) Cluster D
Step-by-Step Solution:
Compute the tariff per active workload instance (Tariff / Workloads) in 2021 for each cluster:
-
Cluster A:
-
Cluster B:
-
Cluster C:
-
Cluster D:
The highest burst ingestion tariff per active workload instance in 2021 was for Cluster D at Rs. 6.00.
Question 3 · Foundation
Directions for Questions 1 to 4
Answer the questions on the basis of the information given below.
Four hyperscale enterprise cloud AI compute clusters—Cluster A, Cluster B, Cluster C, and Cluster D—provide high-throughput GPU model training and burst inference blocks to enterprise clients.
The table below provides the Burst Ingestion Tariff (in Rs. per GPU-Hour processing block) across the 2021–2023 period:
| Cluster | 2021 | 2022 | 2023 |
|---|---|---|---|
| Cluster A | 120000 | 150000 | 180000 |
| Cluster B | 180000 | 210000 | 250000 |
| Cluster C | 150000 | 180000 | 225000 |
| Cluster D | 90000 | 120000 | 160000 |
The bar chart below illustrates the Active Concurrent Enterprise Workloads (in thousands) deployed on each of the four clusters over the same three-year window:
In each year from 2021 to 2023, which cluster had an active workload closest to the average workload across all four clusters in that year?
Show answer and explanation
Answer: (C) Cluster C
Step-by-Step Solution:
Calculate the average workload across all four clusters for each year:
-
2021:
-
Distances from 29.5: A = 4.5, B = 18.5, C = 0.5, D = 14.5.
-
Cluster C is closest.
-
-
2022:
-
Distances from 37.5: A = 3.5, B = 14.5, C = 2.5, D = 13.5.
-
Cluster C is closest.
-
-
2023:
-
Distances from 50.0: A = 10.0, B = 5.0, C = 4.0, D = 9.0.
-
Cluster C is closest.
-
Thus, Cluster C had workloads closest to the average in every single year from 2021 to 2023.
Question 4 · Foundation
Directions for Questions 1 to 4
Answer the questions on the basis of the information given below.
Four hyperscale enterprise cloud AI compute clusters—Cluster A, Cluster B, Cluster C, and Cluster D—provide high-throughput GPU model training and burst inference blocks to enterprise clients.
The table below provides the Burst Ingestion Tariff (in Rs. per GPU-Hour processing block) across the 2021–2023 period:
| Cluster | 2021 | 2022 | 2023 |
|---|---|---|---|
| Cluster A | 120000 | 150000 | 180000 |
| Cluster B | 180000 | 210000 | 250000 |
| Cluster C | 150000 | 180000 | 225000 |
| Cluster D | 90000 | 120000 | 160000 |
The bar chart below illustrates the Active Concurrent Enterprise Workloads (in thousands) deployed on each of the four clusters over the same three-year window:
What was the burst ingestion tariff per active workload instance for Cluster D in the year 2022?
Show answer and explanation
Answer: (B) Rs. 5.00
Step-by-Step Solution:
From the tariff table and workload chart for Cluster D in 2022:
-
Burst Ingestion Tariff = Rs. 120,000 per GPU-Hour block
-
Active Concurrent Workloads = 24,000 instances
Question 5 · Foundation
Directions for Questions 5 and 6
Answer the questions on the basis of the information given below.
Each engineer working in an autonomous robotics and AI hardware division holds exactly one of six seniority designations: Junior Engineer (JE), Associate Architect (AA), Systems Lead (SL), Staff Specialist (SS), Deputy Director (DD), and Group Director (GD).
The bar graph below provides information about the average tenure / experience of engineers across the six designations:
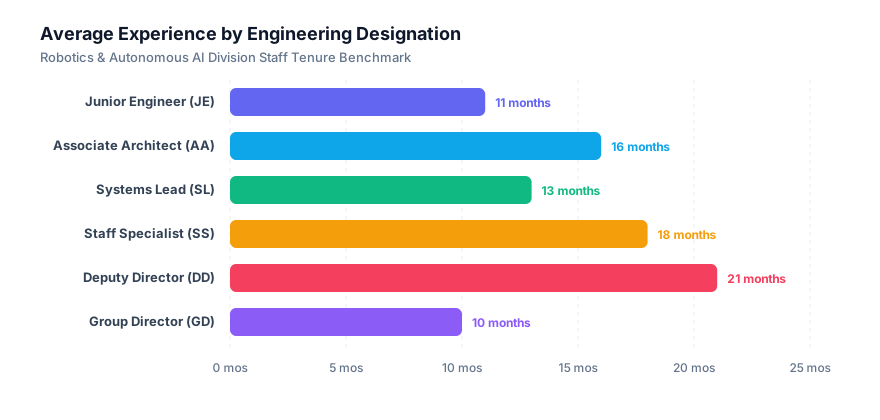
The table below gives the number of engineers with tenure strictly less than or strictly more than the overall average tenure of engineers across the six designations. For each designation, the average tenure of engineers with tenure less than the overall designation average is an integer, and the average tenure of engineers with tenure more than the overall designation average is also an integer.
| Designation | Less than Average Tenure | More than Average Tenure |
|---|---|---|
| Junior Engineer (JE) | 12 | 21 |
| Associate Architect (AA) | 10 | 14 |
| Systems Lead (SL) | 20 | 10 |
| Staff Specialist (SS) | 8 | 18 |
| Deputy Director (DD) | 4 | 10 |
| Group Director (GD) | 8 | 4 |
Find the absolute difference between the aggregate tenure of Junior Engineers with tenure more than the average tenure of Junior Engineers and that of Junior Engineers with tenure less than the average tenure of Junior Engineers.
Show answer and explanation
Answer: (A) 267
Step-by-Step Solution:
-
Set up the Diophantine Equation:
-
For Junior Engineers (JE):
-
Overall average tenure = months.
-
Number of engineers with tenure less than average () = .
-
Number of engineers with tenure more than average () = .
-
Total engineers = .
-
Total aggregate tenure = months.
-
Let be the average tenure of the 12 engineers (), and be the average tenure of the 21 engineers (), where are positive integers.
-
-
Solve for Integer Solutions:
Since , we have .
Also, , so candidate integer values for are .
-
must be divisible by 4:
-
-
Testing valid with :
-
: .
-
Note that , which satisfies all conditions!
-
-
-
Calculate the Required Absolute Difference:
Hence, the correct option is 267.
Question 6 · Foundation
Directions for Questions 5 and 6
Answer the questions on the basis of the information given below.
Each engineer working in an autonomous robotics and AI hardware division holds exactly one of six seniority designations: Junior Engineer (JE), Associate Architect (AA), Systems Lead (SL), Staff Specialist (SS), Deputy Director (DD), and Group Director (GD).
The bar graph below provides information about the average tenure / experience of engineers across the six designations:
The table below gives the number of engineers with tenure strictly less than or strictly more than the overall average tenure of engineers across the six designations. For each designation, the average tenure of engineers with tenure less than the overall designation average is an integer, and the average tenure of engineers with tenure more than the overall designation average is also an integer.
| Designation | Less than Average Tenure | More than Average Tenure |
|---|---|---|
| Junior Engineer (JE) | 12 | 21 |
| Associate Architect (AA) | 10 | 14 |
| Systems Lead (SL) | 20 | 10 |
| Staff Specialist (SS) | 8 | 18 |
| Deputy Director (DD) | 4 | 10 |
| Group Director (GD) | 8 | 4 |
The average tenure of Deputy Directors (DD) with tenure more than 21 months is at least:
Show answer and explanation
Answer: (B) 23
Step-by-Step Solution:
-
Set up the Equation for Deputy Directors:
-
Overall average tenure = months.
-
Engineers with tenure less than average () = .
-
Engineers with tenure more than average () = .
-
Total engineers = .
-
Total aggregate tenure = months.
Let and be the integer average tenure of engineers with tenure less than and more than months respectively:
where .
-
-
Minimize :
-
To minimize , we must maximize while keeping .
-
Rearranging: .
-
Since is even and is odd, must be odd, which implies must be an odd integer.
-
Testing odd integers :
-
For :
Since , this is fully valid!
-
-
Therefore, the minimum possible average tenure of Deputy Directors with experience greater than 21 months is 23 months.
Question 7 · Foundation
Directions for Questions 7 to 10
Answer the questions on the basis of the information given below.
An autonomous hyperloop freight transit shuttle operates along a dedicated high-speed vacuum tube connecting Terminal A to Terminal K, stopping at 9 intermediate automated depot waypoints: B, C, D, E, F, G, H, I, and J. The shuttle network is the exclusive mode of freight transit available along this corridor.
The bar chart below illustrates the distance (in km) between consecutive depot stops:
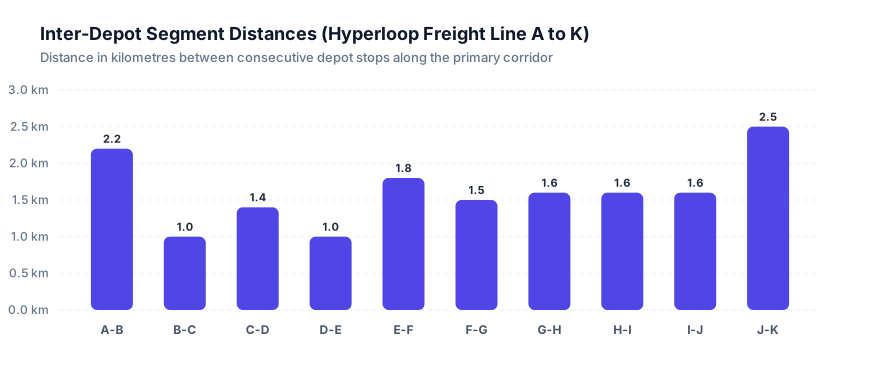
The freight tariff schedule is determined on the basis of either the total distance covered or the number of intermediate depot stops passed (excluding the origin boarding stop and final destination stop), as detailed in the tables below:
| Distance Covered (km) | Tariff (Rs.) | Intermediate Depots | Tariff (Rs.) |
|---|---|---|---|
| 0 to 4.5 | 4 | 0 – 2 | 4 |
| Above 4.5 till 7.5 | 6 | 3 – 5 | 6 |
| Above 7.5 till 11.0 | 10 | 6 – 8 | 10 |
| Above 11.0 till 14.0 | 12 | 9 – 11 | 15 |
| Above 14.0 | 18 | 11+ | 18 |
Fare Computation Rule:
The tariff policy mandates that the fare charged between any two stops is whichever criterion (distance vs. intermediate stops) produces the larger tariff amount. For instance, if traveling across 2 intermediate depots spans 5.0 km, the fare charged is according to distance (Rs. 6). Conversely, if covering 3.0 km spans 4 intermediate depots, the fare charged is according to intermediate stops (Rs. 6).
A container making full utilization of a ticket disembarks at the furthest depot permitted by that ticket's denomination. A logistics operator attempting to minimize or maximize total tariff paid can segment the transit into any number of sub-journeys.
What is the minimum possible total tariff in which freight can be transported from Terminal A to Terminal K?
Show answer and explanation
Answer: (C) Rs. 16
Step-by-Step Solution:
-
Calculate Cumulative Distances from Terminal A:
-
A: km
-
B: km
-
C: km
-
D: km
-
E: km
-
F: km
-
G: km
-
H: km
-
I: km
-
J: km
-
K: km
-
-
Evaluate Single Direct Journey vs. Segmented Multi-Ticket Hops:
-
Direct from A to K:
-
Total distance = km ( km Rs. 18).
-
Intermediate stops = 9 (stops B through J, tariff tier 9–11 Rs. 15).
-
Tariff = .
-
-
-
Find Optimal Sub-Journey Segmentation:
-
Leg 1: Terminal A to Depot F:
-
Distance = km (Within km tier Rs. 6).
-
Intermediate stops: B, C, D, E (4 stops, tier Rs. 6).
-
Tariff = .
-
-
Leg 2: Depot F to Depot J:
-
Distance = km (Within km tier Rs. 6).
-
Intermediate stops: G, H, I (3 stops, tier Rs. 6).
-
Tariff = .
-
-
Leg 3: Depot J to Terminal K:
-
Distance = km (Within km tier Rs. 4).
-
Intermediate stops: 0 (Within tier Rs. 4).
-
Tariff = .
-
-
Total minimum fare = .
Question 8 · Foundation
Directions for Questions 7 to 10
Answer the questions on the basis of the information given below.
An autonomous hyperloop freight transit shuttle operates along a dedicated high-speed vacuum tube connecting Terminal A to Terminal K, stopping at 9 intermediate automated depot waypoints: B, C, D, E, F, G, H, I, and J. The shuttle network is the exclusive mode of freight transit available along this corridor.
The bar chart below illustrates the distance (in km) between consecutive depot stops:
The freight tariff schedule is determined on the basis of either the total distance covered or the number of intermediate depot stops passed (excluding the origin boarding stop and final destination stop), as detailed in the tables below:
| Distance Covered (km) | Tariff (Rs.) | Intermediate Depots | Tariff (Rs.) |
|---|---|---|---|
| 0 to 4.5 | 4 | 0 – 2 | 4 |
| Above 4.5 till 7.5 | 6 | 3 – 5 | 6 |
| Above 7.5 till 11.0 | 10 | 6 – 8 | 10 |
| Above 11.0 till 14.0 | 12 | 9 – 11 | 15 |
| Above 14.0 | 18 | 11+ | 18 |
Fare Computation Rule:
The tariff policy mandates that the fare charged between any two stops is whichever criterion (distance vs. intermediate stops) produces the larger tariff amount. For instance, if traveling across 2 intermediate depots spans 5.0 km, the fare charged is according to distance (Rs. 6). Conversely, if covering 3.0 km spans 4 intermediate depots, the fare charged is according to intermediate stops (Rs. 6).
A container making full utilization of a ticket disembarks at the furthest depot permitted by that ticket's denomination. A logistics operator attempting to minimize or maximize total tariff paid can segment the transit into any number of sub-journeys.
If a logistics provider holds a ticket of denomination Rs. 6, what are the maximum possible number of intermediate depots and the minimum possible number of intermediate depots respectively that the freight can pass through while traveling along the corridor from A to K?
Show answer and explanation
Answer: (D) 4, 2
Step-by-Step Solution:
For a ticket of denomination Rs. 6:
-
The fare must not exceed Rs. 6 by distance (i.e., distance km) AND by intermediate stops (i.e., intermediate stops ).
-
Furthermore, the fare must be at least Rs. 6 (i.e., distance km OR intermediate stops ).
-
Maximum Intermediate Stops:
-
Consider the journey from A to F:
-
Distance = km ( km).
-
Intermediate depots: B, C, D, E = 4 depots.
-
Fare = Rs. 6.
-
(Note: 5 intermediate depots along this route would cover distance exceeding 7.5 km, e.g., A to G = 8.9 km > 7.5 km, which incurs Rs. 10).
-
Hence, maximum intermediate depots = 4.
-
-
-
Minimum Intermediate Stops:
-
To have fewer intermediate depots while still paying Rs. 6, the distance must exceed 4.5 km while covering few depots.
-
Consider Depot H to Terminal K:
-
Intermediate depots: I, J = 2 depots.
-
Distance = km ( km and km).
-
Intermediate stops: 2 (which alone would be Rs. 4, but distance 5.7 km forces tariff to Rs. 6).
-
Tariff = .
-
Hence, minimum intermediate depots = 2.
-
-
Thus, the maximum and minimum number of intermediate depots are 4 and 2 respectively.
Question 9 · Foundation
Directions for Questions 7 to 10
Answer the questions on the basis of the information given below.
An autonomous hyperloop freight transit shuttle operates along a dedicated high-speed vacuum tube connecting Terminal A to Terminal K, stopping at 9 intermediate automated depot waypoints: B, C, D, E, F, G, H, I, and J. The shuttle network is the exclusive mode of freight transit available along this corridor.
The bar chart below illustrates the distance (in km) between consecutive depot stops:
The freight tariff schedule is determined on the basis of either the total distance covered or the number of intermediate depot stops passed (excluding the origin boarding stop and final destination stop), as detailed in the tables below:
| Distance Covered (km) | Tariff (Rs.) | Intermediate Depots | Tariff (Rs.) |
|---|---|---|---|
| 0 to 4.5 | 4 | 0 – 2 | 4 |
| Above 4.5 till 7.5 | 6 | 3 – 5 | 6 |
| Above 7.5 till 11.0 | 10 | 6 – 8 | 10 |
| Above 11.0 till 14.0 | 12 | 9 – 11 | 15 |
| Above 14.0 | 18 | 11+ | 18 |
Fare Computation Rule:
The tariff policy mandates that the fare charged between any two stops is whichever criterion (distance vs. intermediate stops) produces the larger tariff amount. For instance, if traveling across 2 intermediate depots spans 5.0 km, the fare charged is according to distance (Rs. 6). Conversely, if covering 3.0 km spans 4 intermediate depots, the fare charged is according to intermediate stops (Rs. 6).
A container making full utilization of a ticket disembarks at the furthest depot permitted by that ticket's denomination. A logistics operator attempting to minimize or maximize total tariff paid can segment the transit into any number of sub-journeys.
A seasonal logistics promotion offers an unlimited single round-trip ticket from Terminal A to Terminal K and back to Terminal A (without terminating at K) for Rs. 22. What is the difference between the maximum possible tariff paid (with at least one intermediate depot for each sub-journey) and the promotional ticket tariff for the round trip?
Show answer and explanation
Answer: (C) Rs. 18
Step-by-Step Solution:
-
Calculate the Maximum Possible Tariff for the Round Trip:
-
To maximize the tariff paid with at least one intermediate depot per sub-journey, each ticket purchased should be of the minimum denomination (Rs. 4) covering exactly 2 hops (1 intermediate depot).
-
Each 2-hop journey has 1 intermediate depot and distance km:
-
Leg 1: A to C = km, 1 stop (B) Rs. 4
-
Leg 2: C to E = km, 1 stop (D) Rs. 4
-
Leg 3: E to G = km, 1 stop (F) Rs. 4
-
Leg 4: G to I = km, 1 stop (H) Rs. 4
-
Leg 5: I to K = km, 1 stop (J) Rs. 4
-
-
Total forward journey (A to K) in 5 sub-journeys = .
-
By symmetry, the return journey (K to A) in 5 sub-journeys = .
-
Maximum total tariff paid = .
-
-
Evaluate the Difference:
Hence, the correct option is Rs. 18.
Question 10 · Foundation
Directions for Questions 7 to 10
Answer the questions on the basis of the information given below.
An autonomous hyperloop freight transit shuttle operates along a dedicated high-speed vacuum tube connecting Terminal A to Terminal K, stopping at 9 intermediate automated depot waypoints: B, C, D, E, F, G, H, I, and J. The shuttle network is the exclusive mode of freight transit available along this corridor.
The bar chart below illustrates the distance (in km) between consecutive depot stops:
The freight tariff schedule is determined on the basis of either the total distance covered or the number of intermediate depot stops passed (excluding the origin boarding stop and final destination stop), as detailed in the tables below:
| Distance Covered (km) | Tariff (Rs.) | Intermediate Depots | Tariff (Rs.) |
|---|---|---|---|
| 0 to 4.5 | 4 | 0 – 2 | 4 |
| Above 4.5 till 7.5 | 6 | 3 – 5 | 6 |
| Above 7.5 till 11.0 | 10 | 6 – 8 | 10 |
| Above 11.0 till 14.0 | 12 | 9 – 11 | 15 |
| Above 14.0 | 18 | 11+ | 18 |
Fare Computation Rule:
The tariff policy mandates that the fare charged between any two stops is whichever criterion (distance vs. intermediate stops) produces the larger tariff amount. For instance, if traveling across 2 intermediate depots spans 5.0 km, the fare charged is according to distance (Rs. 6). Conversely, if covering 3.0 km spans 4 intermediate depots, the fare charged is according to intermediate stops (Rs. 6).
A container making full utilization of a ticket disembarks at the furthest depot permitted by that ticket's denomination. A logistics operator attempting to minimize or maximize total tariff paid can segment the transit into any number of sub-journeys.
Additional Information for Question 10:
Due to vacuum chamber maintenance, the direct tube section between G and H is temporarily closed. Shuttles reach H from G via an automated auxiliary detour bypass: Route G-M-N-O-H. The segment distances along this detour are illustrated below:
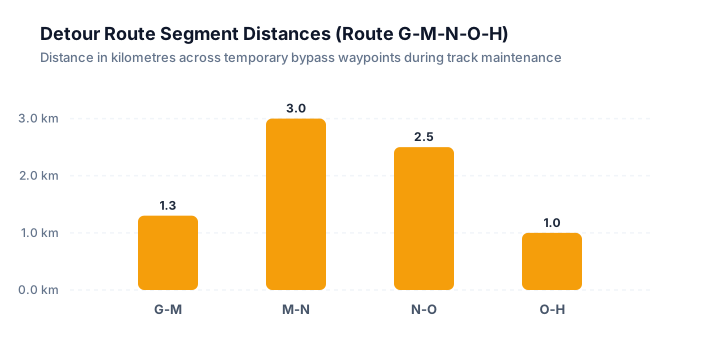
What is the ratio of the minimum possible tariff to travel from Depot B to Depot I under the standard corridor layout to the maximum possible tariff to travel from Depot C to Depot J via the detour bypass (with at least one intermediate depot for each sub-journey)?
Show answer and explanation
Answer: (A) 1 : 2
Step-by-Step Solution:
-
Minimum Tariff from B to I under Standard Route:
-
Distance from B to I = km.
-
Intermediate depots: C, D, E, F, G, H = 6 depots.
-
Distance tier ( km) Rs. 10.
-
Stop tier ( stops) Rs. 10.
-
(Or taking B to G at Rs. 6 and G to I at Rs. 4 gives ).
-
Hence, minimum tariff from B to I = Rs. 10.
-
-
Maximum Tariff from C to J via Detour Bypass:
-
To maximize tariff with at least one intermediate stop per sub-journey, buy Rs. 4 tickets for 2-hop segments:
-
Hop 1: C to E (1 stop D, dist km) Rs. 4
-
Hop 2: E to G (1 stop F, dist km) Rs. 4
-
Hop 3: G to N via M (1 stop M, dist km km) Rs. 4
-
Hop 4: N to H via O (1 stop O, dist km km) Rs. 4
-
Hop 5: H to J via I (1 stop I, dist km km) Rs. 4
-
-
Total sub-journeys = 5 hops Rs. 4 = Rs. 20.
-
-
Compute the Ratio:
Hence, the correct option is 1 : 2.
Question 11 · Foundation
Directions for Questions 11 to 13
Answer the questions on the basis of the information given below.
Five specialized AI hardware and infrastructure providers—AlphaEdge, ByteScale, Cerebro, DataMatrix, and EchoNova—generate operational revenues (in million Rs.) through two computing hardware delivery modes: Edge Accelerators (Edge) and Datacenter Dedicated Server Racks (Cloud).
The bar chart below illustrates the total revenue generated by each provider across both delivery modes:
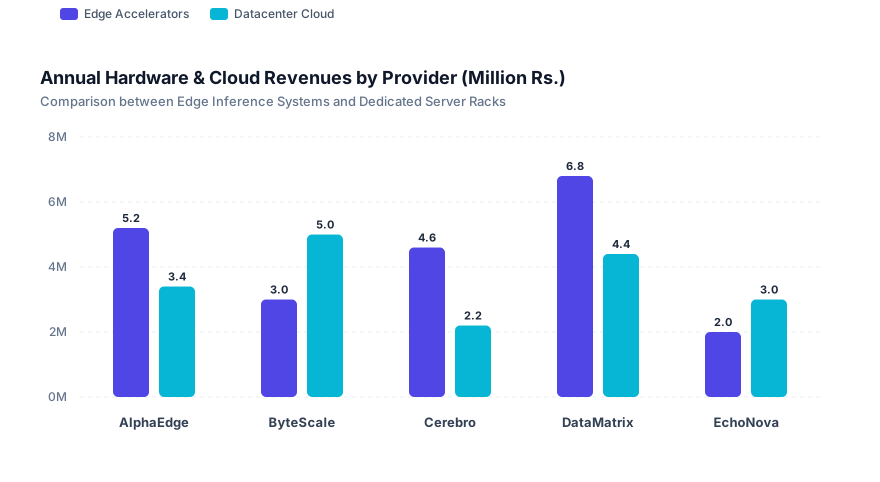
The table below indicates the percentage break-up of revenues generated across Corporate Enterprise accounts (Corp) and Institutional / Public accounts (Inst):
| Provider | Edge Accelerators (%) | Datacenter Cloud (%) | ||
|---|---|---|---|---|
| Corporate (Corp) | Institutional (Inst) | Corporate (Corp) | Institutional (Inst) | |
| AlphaEdge | 75 | 25 | 80 | 20 |
| ByteScale | 60 | 40 | 50 | 50 |
| Cerebro | 85 | 15 | 70 | 30 |
| DataMatrix | 80 | 20 | 65 | 35 |
| EchoNova | 50 | 50 | 90 | 10 |
Market Dominance Rule:
A provider is said to dominate another provider , either in the Edge Accelerator market or in the Datacenter Cloud market, only if provider 's sales are strictly greater than provider 's sales in each of the two client segments (Corp and Inst) individually.
How many of the given infrastructure providers dominate ByteScale in the Edge Accelerator market as well as in the Datacenter Cloud market?
Show answer and explanation
Answer: (A) 0
Step-by-Step Solution:
-
Calculate Segment Revenues for ByteScale:
-
Edge Accelerators: Total = M Corp = M, Inst = M.
-
Datacenter Cloud: Total = M Corp = M, Inst = M.
-
-
Evaluate Competitors in Datacenter Cloud Market:
To dominate ByteScale in Datacenter Cloud, a provider must have Corp M and Inst M.
-
AlphaEdge: Corp = M, Inst = M (, does not dominate).
-
Cerebro: Corp = M, Inst = M (, does not dominate).
-
DataMatrix: Corp = M, Inst = M (, does not dominate).
-
EchoNova: Corp = M, Inst = M (, does not dominate).
-
No provider has an Institutional Cloud revenue greater than M. Therefore, no provider dominates ByteScale in the Datacenter Cloud market, and consequently 0 providers dominate ByteScale in both markets.
Question 12 · Foundation
Directions for Questions 11 to 13
Answer the questions on the basis of the information given below.
Five specialized AI hardware and infrastructure providers—AlphaEdge, ByteScale, Cerebro, DataMatrix, and EchoNova—generate operational revenues (in million Rs.) through two computing hardware delivery modes: Edge Accelerators (Edge) and Datacenter Dedicated Server Racks (Cloud).
The bar chart below illustrates the total revenue generated by each provider across both delivery modes:
The table below indicates the percentage break-up of revenues generated across Corporate Enterprise accounts (Corp) and Institutional / Public accounts (Inst):
| Provider | Edge Accelerators (%) | Datacenter Cloud (%) | ||
|---|---|---|---|---|
| Corporate (Corp) | Institutional (Inst) | Corporate (Corp) | Institutional (Inst) | |
| AlphaEdge | 75 | 25 | 80 | 20 |
| ByteScale | 60 | 40 | 50 | 50 |
| Cerebro | 85 | 15 | 70 | 30 |
| DataMatrix | 80 | 20 | 65 | 35 |
| EchoNova | 50 | 50 | 90 | 10 |
Market Dominance Rule:
A provider is said to dominate another provider , either in the Edge Accelerator market or in the Datacenter Cloud market, only if provider 's sales are strictly greater than provider 's sales in each of the two client segments (Corp and Inst) individually.
How many providers are definitely not dominated by any other provider in the Datacenter Cloud market?
Show answer and explanation
Answer: (C) 2
Step-by-Step Solution:
Compute Datacenter Cloud sales (Corp, Inst) for all 5 providers (in million Rs.):
-
AlphaEdge:
-
ByteScale:
-
Cerebro:
-
DataMatrix:
-
EchoNova:
-
Check DataMatrix:
-
Corp = M (highest across all 5 providers).
-
Since no provider has a higher Corp revenue, DataMatrix cannot be dominated by any provider.
-
-
Check ByteScale:
-
Inst = M (highest across all 5 providers).
-
Since no provider has a higher Inst revenue, ByteScale cannot be dominated by any provider.
-
-
Check Remaining Providers:
-
AlphaEdge is dominated by DataMatrix and .
-
Cerebro is dominated by DataMatrix and .
-
EchoNova is dominated by DataMatrix and .
-
Thus, exactly 2 providers (ByteScale and DataMatrix) are definitely not dominated by any other provider in the Datacenter Cloud market.
Question 13 · Foundation
Directions for Questions 11 to 13
Answer the questions on the basis of the information given below.
Five specialized AI hardware and infrastructure providers—AlphaEdge, ByteScale, Cerebro, DataMatrix, and EchoNova—generate operational revenues (in million Rs.) through two computing hardware delivery modes: Edge Accelerators (Edge) and Datacenter Dedicated Server Racks (Cloud).
The bar chart below illustrates the total revenue generated by each provider across both delivery modes:
The table below indicates the percentage break-up of revenues generated across Corporate Enterprise accounts (Corp) and Institutional / Public accounts (Inst):
| Provider | Edge Accelerators (%) | Datacenter Cloud (%) | ||
|---|---|---|---|---|
| Corporate (Corp) | Institutional (Inst) | Corporate (Corp) | Institutional (Inst) | |
| AlphaEdge | 75 | 25 | 80 | 20 |
| ByteScale | 60 | 40 | 50 | 50 |
| Cerebro | 85 | 15 | 70 | 30 |
| DataMatrix | 80 | 20 | 65 | 35 |
| EchoNova | 50 | 50 | 90 | 10 |
Market Dominance Rule:
A provider is said to dominate another provider , either in the Edge Accelerator market or in the Datacenter Cloud market, only if provider 's sales are strictly greater than provider 's sales in each of the two client segments (Corp and Inst) individually.
What is the absolute difference (in million Rs.) between the revenue generated by the five providers in the Corporate segment through Edge Accelerators and that generated in the Institutional segment through Datacenter Cloud?
Show answer and explanation
Answer: (C) 10.37
Step-by-Step Solution:
-
Corporate Revenue through Edge Accelerators:
-
AlphaEdge: M
-
ByteScale: M
-
Cerebro: M
-
DataMatrix: M
-
EchoNova: M
-
-
Institutional Revenue through Datacenter Cloud:
-
AlphaEdge: M
-
ByteScale: M
-
Cerebro: M
-
DataMatrix: M
-
EchoNova: M
-
-
Absolute Difference:
Hence, the correct option is 10.37.
Question 14 · Foundation
Directions for Questions 11 to 13
Answer the questions on the basis of the information given below.
Five specialized AI hardware and infrastructure providers—AlphaEdge, ByteScale, Cerebro, DataMatrix, and EchoNova—generate operational revenues (in million Rs.) through two computing hardware delivery modes: Edge Accelerators (Edge) and Datacenter Dedicated Server Racks (Cloud).
The bar chart below illustrates the total revenue generated by each provider across both delivery modes:
The table below indicates the percentage break-up of revenues generated across Corporate Enterprise accounts (Corp) and Institutional / Public accounts (Inst):
| Provider | Edge Accelerators (%) | Datacenter Cloud (%) | ||
|---|---|---|---|---|
| Corporate (Corp) | Institutional (Inst) | Corporate (Corp) | Institutional (Inst) | |
| AlphaEdge | 75 | 25 | 80 | 20 |
| ByteScale | 60 | 40 | 50 | 50 |
| Cerebro | 85 | 15 | 70 | 30 |
| DataMatrix | 80 | 20 | 65 | 35 |
| EchoNova | 50 | 50 | 90 | 10 |
Market Dominance Rule:
A provider is said to dominate another provider , either in the Edge Accelerator market or in the Datacenter Cloud market, only if provider 's sales are strictly greater than provider 's sales in each of the two client segments (Corp and Inst) individually.
How many of the given infrastructure providers dominate ByteScale in the Edge Accelerator market as well as in the Datacenter Cloud market?
Show answer and explanation
Answer: (A) None
Step-by-Step Solution:
ByteScale's Institutional revenue in the Datacenter Cloud market is million Rs.
The Institutional Cloud revenues for the other four providers are:
-
AlphaEdge: M
-
Cerebro: M
-
DataMatrix: M
-
EchoNova: M
Because none of the other providers have Institutional Cloud revenues exceeding M, no provider dominates ByteScale in the Cloud market. Consequently, None of the providers dominate ByteScale in both markets.
Question 15 · Foundation
Directions for Questions 11 to 13
Answer the questions on the basis of the information given below.
Five specialized AI hardware and infrastructure providers—AlphaEdge, ByteScale, Cerebro, DataMatrix, and EchoNova—generate operational revenues (in million Rs.) through two computing hardware delivery modes: Edge Accelerators (Edge) and Datacenter Dedicated Server Racks (Cloud).
The bar chart below illustrates the total revenue generated by each provider across both delivery modes:
The table below indicates the percentage break-up of revenues generated across Corporate Enterprise accounts (Corp) and Institutional / Public accounts (Inst):
| Provider | Edge Accelerators (%) | Datacenter Cloud (%) | ||
|---|---|---|---|---|
| Corporate (Corp) | Institutional (Inst) | Corporate (Corp) | Institutional (Inst) | |
| AlphaEdge | 75 | 25 | 80 | 20 |
| ByteScale | 60 | 40 | 50 | 50 |
| Cerebro | 85 | 15 | 70 | 30 |
| DataMatrix | 80 | 20 | 65 | 35 |
| EchoNova | 50 | 50 | 90 | 10 |
Market Dominance Rule:
A provider is said to dominate another provider , either in the Edge Accelerator market or in the Datacenter Cloud market, only if provider 's sales are strictly greater than provider 's sales in each of the two client segments (Corp and Inst) individually.
How many providers are definitely not dominated by any other provider in the Datacenter Cloud market?
Show answer and explanation
Answer: (B) 2
Step-by-Step Solution:
In the Datacenter Cloud market:
-
DataMatrix has Corporate revenue of M, which is strictly greater than all other providers. Thus, DataMatrix cannot be dominated by any provider.
-
ByteScale has Institutional revenue of M, which is strictly greater than all other providers. Thus, ByteScale cannot be dominated by any provider.
-
Every other provider is dominated by DataMatrix:
-
AlphaEdge
-
Cerebro
-
EchoNova
-
Thus, exactly 2 providers (ByteScale and DataMatrix) are not dominated.
Question 16 · Moderate
Directions for Questions 11 to 13
Answer the questions on the basis of the information given below.
Five specialized AI hardware and infrastructure providers—AlphaEdge, ByteScale, Cerebro, DataMatrix, and EchoNova—generate operational revenues (in million Rs.) through two computing hardware delivery modes: Edge Accelerators (Edge) and Datacenter Dedicated Server Racks (Cloud).
The bar chart below illustrates the total revenue generated by each provider across both delivery modes:
The table below indicates the percentage break-up of revenues generated across Corporate Enterprise accounts (Corp) and Institutional / Public accounts (Inst):
| Provider | Edge Accelerators (%) | Datacenter Cloud (%) | ||
|---|---|---|---|---|
| Corporate (Corp) | Institutional (Inst) | Corporate (Corp) | Institutional (Inst) | |
| AlphaEdge | 75 | 25 | 80 | 20 |
| ByteScale | 60 | 40 | 50 | 50 |
| Cerebro | 85 | 15 | 70 | 30 |
| DataMatrix | 80 | 20 | 65 | 35 |
| EchoNova | 50 | 50 | 90 | 10 |
Market Dominance Rule:
A provider is said to dominate another provider , either in the Edge Accelerator market or in the Datacenter Cloud market, only if provider 's sales are strictly greater than provider 's sales in each of the two client segments (Corp and Inst) individually.
What is the absolute difference (in million Rs.) between the revenue generated by the five providers in the Corporate segment through Edge Accelerators and that generated in the Institutional segment through Datacenter Cloud?
Show answer and explanation
Answer: (C) 10.37
Step-by-Step Solution:
-
Total Corporate Edge Revenue = million Rs.
-
Total Institutional Cloud Revenue = million Rs.
-
Absolute Difference = million Rs.
Question 17 · Moderate
Directions for Questions 11 to 13
Answer the questions on the basis of the information given below.
Five specialized AI hardware and infrastructure providers—AlphaEdge, ByteScale, Cerebro, DataMatrix, and EchoNova—generate operational revenues (in million Rs.) through two computing hardware delivery modes: Edge Accelerators (Edge) and Datacenter Dedicated Server Racks (Cloud).
The bar chart below illustrates the total revenue generated by each provider across both delivery modes:
The table below indicates the percentage break-up of revenues generated across Corporate Enterprise accounts (Corp) and Institutional / Public accounts (Inst):
| Provider | Edge Accelerators (%) | Datacenter Cloud (%) | ||
|---|---|---|---|---|
| Corporate (Corp) | Institutional (Inst) | Corporate (Corp) | Institutional (Inst) | |
| AlphaEdge | 75 | 25 | 80 | 20 |
| ByteScale | 60 | 40 | 50 | 50 |
| Cerebro | 85 | 15 | 70 | 30 |
| DataMatrix | 80 | 20 | 65 | 35 |
| EchoNova | 50 | 50 | 90 | 10 |
Market Dominance Rule:
A provider is said to dominate another provider , either in the Edge Accelerator market or in the Datacenter Cloud market, only if provider 's sales are strictly greater than provider 's sales in each of the two client segments (Corp and Inst) individually.
If the revenue generated by a provider through Edge Accelerators is at least 150% of that generated through Datacenter Cloud, that provider is designated a 'Dynamic Computing Provider'. How many Dynamic Computing Providers are there?
Show answer and explanation
Answer: (D) 3
Step-by-Step Solution:
Calculate the ratio of Edge Accelerator revenue to Datacenter Cloud revenue for each provider:
-
AlphaEdge: (Dynamic)
-
ByteScale:
-
Cerebro: (Dynamic)
-
DataMatrix: (Dynamic)
-
EchoNova:
There are 3 Dynamic Computing Providers: AlphaEdge, Cerebro, and DataMatrix.
Question 18 · Moderate
Directions for Questions 18 to 21
Answer the questions on the basis of the information given below.
The pie chart below gives the distribution of a Rs. 9,000 Crore sovereign clean energy and semiconductor loan fund disbursed across eleven Asian partner nations in 2021:
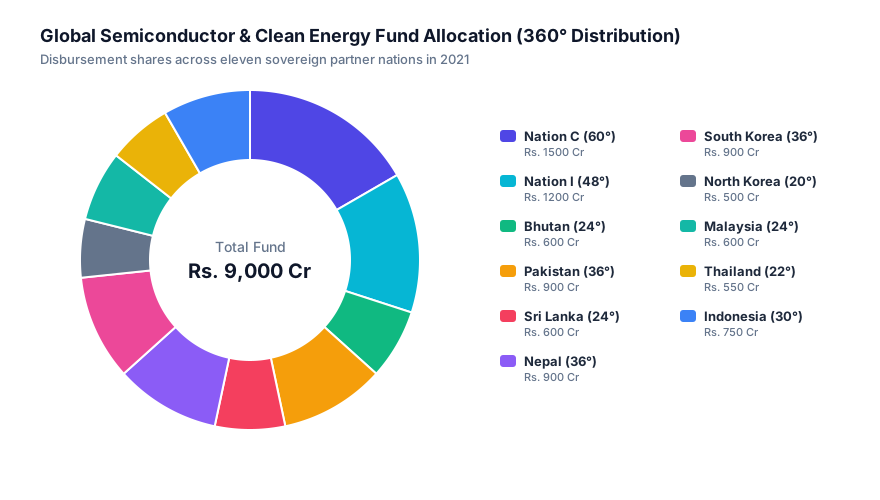
The line graph below illustrates the percentage contribution of the sovereign loan facility in the total capital investment made across six key industrial sectors in 2021 by Nation C (China) and Nation I (India):
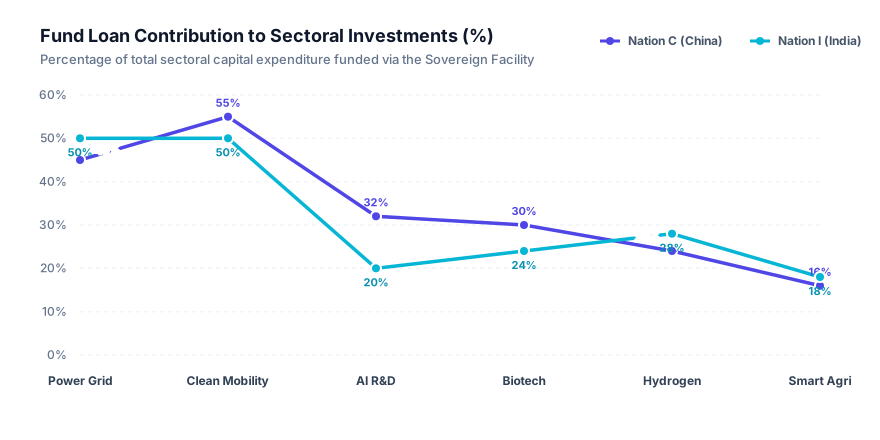
(Note: For both Nation C and Nation I, the entire loan received from the sovereign facility was deployed exclusively across the six given sectors).
If the total capital investment in the AI R&D sector in Nation C was 60% higher than that in Nation I, what is the ratio of A and B, where A is the percentage of total loan from the facility invested in AI R&D by Nation C, and B is the percentage of total loan from the facility invested in AI R&D by Nation I?
Show answer and explanation
Answer: (A) 256 : 125
Step-by-Step Solution:
-
Calculate Total Loans Received:
-
Nation C (): .
-
Nation I (): .
-
-
Formulate Loan Investments in AI R&D:
-
Let total capital investment in AI R&D by Nation I be crore.
-
Total capital investment in AI R&D by Nation C = crore.
-
For Nation C, loan contribution in AI R&D = :
-
For Nation I, loan contribution in AI R&D = :
-
-
Compute the Ratio :
Hence, the correct option is 256 : 125.
Question 19 · Moderate
Directions for Questions 18 to 21
Answer the questions on the basis of the information given below.
The pie chart below gives the distribution of a Rs. 9,000 Crore sovereign clean energy and semiconductor loan fund disbursed across eleven Asian partner nations in 2021:
The line graph below illustrates the percentage contribution of the sovereign loan facility in the total capital investment made across six key industrial sectors in 2021 by Nation C (China) and Nation I (India):
(Note: For both Nation C and Nation I, the entire loan received from the sovereign facility was deployed exclusively across the six given sectors).
The amount of loan invested in Clean Mobility by Nation C was equal to 60% of the total loan received by Malaysia. The amount of loan invested in Clean Mobility by Nation I was equal to 60% of the total loan received by North Korea. The total capital investment made in Clean Mobility by Nation I was approximately what percent of that made by Nation C?
Show answer and explanation
Answer: (B) 91.7%
Step-by-Step Solution:
-
Calculate Sovereign Loans Received by Benchmark Countries:
-
Malaysia (): .
-
North Korea (): .
-
-
Calculate Mobility Loan Amounts and Total Investments:
-
For Nation C:
-
Loan in Clean Mobility = .
-
From the line graph, loan contribution in Clean Mobility = .
-
Total investment in Clean Mobility = .
-
-
For Nation I:
-
Loan in Clean Mobility = .
-
From the line graph, loan contribution in Clean Mobility = .
-
Total investment in Clean Mobility = .
-
-
-
Calculate the Percentage:
Hence, the correct option is 91.7%.
Question 20 · Moderate
Directions for Questions 18 to 21
Answer the questions on the basis of the information given below.
The pie chart below gives the distribution of a Rs. 9,000 Crore sovereign clean energy and semiconductor loan fund disbursed across eleven Asian partner nations in 2021:
The line graph below illustrates the percentage contribution of the sovereign loan facility in the total capital investment made across six key industrial sectors in 2021 by Nation C (China) and Nation I (India):
(Note: For both Nation C and Nation I, the entire loan received from the sovereign facility was deployed exclusively across the six given sectors).
If the total capital investments made in AI R&D, Biotech, and Smart Agri in Nation I in 2021 were Rs. 180 Cr, Rs. 150 Cr, and Rs. 450 Cr respectively, what percentage of the total loan received by Nation I was invested in these three sectors?
Show answer and explanation
Answer: (A) 12.75%
Step-by-Step Solution:
-
Calculate Loan Incurred by Sector in Nation I:
-
AI R&D: .
-
Biotech: .
-
Smart Agri: .
-
Total loan deployed in these three sectors = .
-
-
Evaluate Percentage of Nation I's Total Loan:
- Total loan received by Nation I = .
Hence, the correct option is 12.75%.
Question 21 · Moderate
Directions for Questions 18 to 21
Answer the questions on the basis of the information given below.
The pie chart below gives the distribution of a Rs. 9,000 Crore sovereign clean energy and semiconductor loan fund disbursed across eleven Asian partner nations in 2021:
The line graph below illustrates the percentage contribution of the sovereign loan facility in the total capital investment made across six key industrial sectors in 2021 by Nation C (China) and Nation I (India):
(Note: For both Nation C and Nation I, the entire loan received from the sovereign facility was deployed exclusively across the six given sectors).
The total loan invested in Power Grid, Clean Mobility, and AI R&D by Nation I was Rs. 600 Cr. Assuming at least Rs. 30 Cr of loan was allocated to each of the three sectors, what could be the maximum possible total capital investment in these three sectors in Nation I?
Show answer and explanation
Answer: (C) Rs. 2,820 Cr
Step-by-Step Solution:
-
Sector Multipliers (Total Investment per Rs. 1 of Loan):
-
Power Grid: Loan contribution = .
-
Clean Mobility: Loan contribution = .
-
AI R&D: Loan contribution = .
-
-
Maximize Total Investment:
To maximize total investment, allocate the maximum possible loan amount to the sector with the highest multiplier (AI R&D with 5.0x), while allocating the mandatory minimum (Rs. 30 Cr) to the other two sectors:
-
Power Grid: Rs. 30 Cr loan investment.
-
Clean Mobility: Rs. 30 Cr loan investment.
-
AI R&D: loan investment.
-
-
Total Maximum Investment:
Hence, the correct option is Rs. 2,820 Cr.
Question 22 · Moderate
Directions for Questions 22 to 25
Answer the questions on the basis of the information given below.
ApexVenture (AV) and PeakScale (PS) are two premier technology startup accelerators that prepare early-stage deep-tech ventures for prestigious institutional Series-A syndicates.
The evaluation process consists of a technical audit followed by partner interviews. Only startups that clear the technical audit receive formal term sheet calls from venture capital syndicates (ranging from 1 to 6 calls depending on technical rating). If a startup successfully executes a term sheet, its calls are said to be converted (securing institutional capital). A startup enrolled with one accelerator does not enroll with the other.
The chart below shows the total number of startups enrolled (in thousands) across both accelerators from 2019 to 2023:
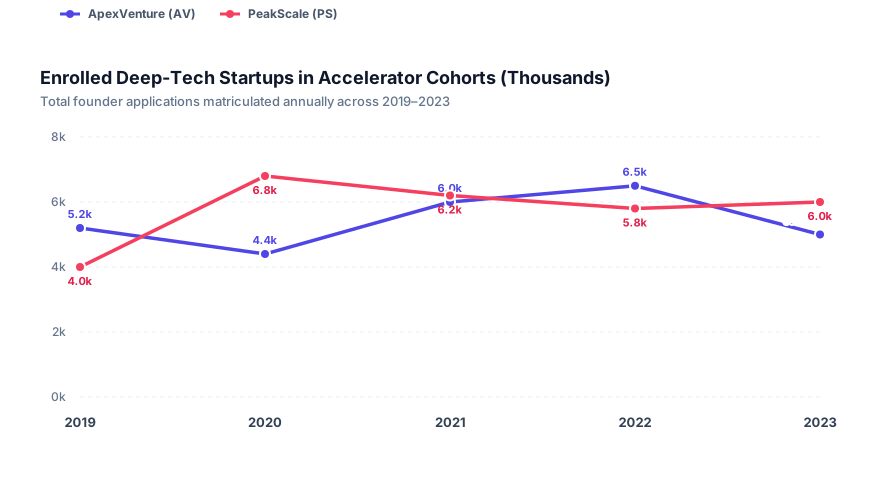
The table below provides the term sheet call status of startups across the five-year period:
| Year | Total Startups Receiving Term Sheet Calls | Startups Receiving > 3 Term Sheet Calls | Final Startups Converting Calls | |||
|---|---|---|---|---|---|---|
| AV | PS | AV | PS | AV | PS | |
| 2019 | 140 | 120 | 75 | 50 | 91 | 72 |
| 2020 | 130 | 135 | 70 | 68 | 86 | 92 |
| 2021 | 140 | 150 | 60 | 60 | 80 | 81 |
| 2022 | 125 | 115 | 68 | 64 | 85 | 81 |
| 2023 | 130 | 120 | 70 | 55 | 87 | 72 |
In which year was the conversion strike rate of ApexVenture (AV) maximum?
Show answer and explanation
Answer: (C) 2022
Step-by-Step Solution:
Compute the strike rate for ApexVenture (AV) across all five years:
-
2019:
-
2020:
-
2021:
-
2022:
-
2023:
The conversion strike rate was highest in 2022 at .
Question 23 · Moderate
Directions for Questions 22 to 25
Answer the questions on the basis of the information given below.
ApexVenture (AV) and PeakScale (PS) are two premier technology startup accelerators that prepare early-stage deep-tech ventures for prestigious institutional Series-A syndicates.
The evaluation process consists of a technical audit followed by partner interviews. Only startups that clear the technical audit receive formal term sheet calls from venture capital syndicates (ranging from 1 to 6 calls depending on technical rating). If a startup successfully executes a term sheet, its calls are said to be converted (securing institutional capital). A startup enrolled with one accelerator does not enroll with the other.
The chart below shows the total number of startups enrolled (in thousands) across both accelerators from 2019 to 2023:
The table below provides the term sheet call status of startups across the five-year period:
| Year | Total Startups Receiving Term Sheet Calls | Startups Receiving > 3 Term Sheet Calls | Final Startups Converting Calls | |||
|---|---|---|---|---|---|---|
| AV | PS | AV | PS | AV | PS | |
| 2019 | 140 | 120 | 75 | 50 | 91 | 72 |
| 2020 | 130 | 135 | 70 | 68 | 86 | 92 |
| 2021 | 140 | 150 | 60 | 60 | 80 | 81 |
| 2022 | 125 | 115 | 68 | 64 | 85 | 81 |
| 2023 | 130 | 120 | 70 | 55 | 87 | 72 |
For how many years during the period 2019–2023 was the conversion strike rate of PeakScale (PS) strictly better than that of ApexVenture (AV)?
Show answer and explanation
Answer: (B) 2
Step-by-Step Solution:
Compare the annual conversion strike rates between PS and AV:
-
2019: AV = , PS = (AV was better)
-
2020: AV = , PS = (PS was better)
-
2021: AV = , PS = (AV was better)
-
2022: AV = , PS = (PS was better)
-
2023: AV = , PS = (AV was better)
The strike rate of PeakScale was strictly better than ApexVenture in 2 years (2020 and 2022).
Question 24 · Moderate
Directions for Questions 22 to 25
Answer the questions on the basis of the information given below.
ApexVenture (AV) and PeakScale (PS) are two premier technology startup accelerators that prepare early-stage deep-tech ventures for prestigious institutional Series-A syndicates.
The evaluation process consists of a technical audit followed by partner interviews. Only startups that clear the technical audit receive formal term sheet calls from venture capital syndicates (ranging from 1 to 6 calls depending on technical rating). If a startup successfully executes a term sheet, its calls are said to be converted (securing institutional capital). A startup enrolled with one accelerator does not enroll with the other.
The chart below shows the total number of startups enrolled (in thousands) across both accelerators from 2019 to 2023:
The table below provides the term sheet call status of startups across the five-year period:
| Year | Total Startups Receiving Term Sheet Calls | Startups Receiving > 3 Term Sheet Calls | Final Startups Converting Calls | |||
|---|---|---|---|---|---|---|
| AV | PS | AV | PS | AV | PS | |
| 2019 | 140 | 120 | 75 | 50 | 91 | 72 |
| 2020 | 130 | 135 | 70 | 68 | 86 | 92 |
| 2021 | 140 | 150 | 60 | 60 | 80 | 81 |
| 2022 | 125 | 115 | 68 | 64 | 85 | 81 |
| 2023 | 130 | 120 | 70 | 55 | 87 | 72 |
If it is assumed that all startups that received more than 3 term sheet calls converted their calls, in which year was the total number of startups across both accelerators that received 3 or fewer calls and successfully converted their calls maximum?
Show answer and explanation
Answer: (C) 2021
Step-by-Step Solution:
Under the given assumption:
Calculate the combined total across both accelerators for each year:
-
2019:
-
2020:
-
2021:
-
2022:
-
2023:
The total was maximum in 2021 (41 startups).
Question 25 · Moderate
Directions for Questions 22 to 25
Answer the questions on the basis of the information given below.
ApexVenture (AV) and PeakScale (PS) are two premier technology startup accelerators that prepare early-stage deep-tech ventures for prestigious institutional Series-A syndicates.
The evaluation process consists of a technical audit followed by partner interviews. Only startups that clear the technical audit receive formal term sheet calls from venture capital syndicates (ranging from 1 to 6 calls depending on technical rating). If a startup successfully executes a term sheet, its calls are said to be converted (securing institutional capital). A startup enrolled with one accelerator does not enroll with the other.
The chart below shows the total number of startups enrolled (in thousands) across both accelerators from 2019 to 2023:
The table below provides the term sheet call status of startups across the five-year period:
| Year | Total Startups Receiving Term Sheet Calls | Startups Receiving > 3 Term Sheet Calls | Final Startups Converting Calls | |||
|---|---|---|---|---|---|---|
| AV | PS | AV | PS | AV | PS | |
| 2019 | 140 | 120 | 75 | 50 | 91 | 72 |
| 2020 | 130 | 135 | 70 | 68 | 86 | 92 |
| 2021 | 140 | 150 | 60 | 60 | 80 | 81 |
| 2022 | 125 | 115 | 68 | 64 | 85 | 81 |
| 2023 | 130 | 120 | 70 | 55 | 87 | 72 |
What is the absolute difference between the average annual number of startups enrolled with ApexVenture (AV) and PeakScale (PS) over the five-year period?
Show answer and explanation
Answer: (C) 340
Step-by-Step Solution:
From the line chart, total enrolled startups over 5 years (in thousands):
-
ApexVenture (AV):
-
PeakScale (PS):
-
Absolute Difference:
Hence, the correct option is 340.
Question 26 · Moderate
Directions for Questions 26 to 29
Answer the questions on the basis of the information given below.
Enterprise Alpha and Rival Beta are two competing software security providers operating in the enterprise cloud defense sector. Enterprise Alpha can adopt any one of three architecture strategies: X, Y, or Z, while Rival Beta can in turn respond by adopting any one of three defense tactics: P, Q, or R.
The table below gives the gross payoff to Enterprise Alpha depending on which strategy it adopts and which tactic Rival Beta adopts in response. A positive value indicates Enterprise Alpha gains and Rival Beta loses that gross amount, whereas a negative value indicates Enterprise Alpha loses and Rival Beta gains that gross amount.
| Enterprise Alpha Strategy | Rival Beta Response Tactic | ||
|---|---|---|---|
| Tactic P | Tactic Q | Tactic R | |
| Strategy X | -4200 | 5200 | -6200 |
| Strategy Y | 6000 | -5400 | 5600 |
| Strategy Z | -6400 | 4600 | -6600 |
Furthermore, both enterprises incur operational deployment costs in executing these strategies, as detailed below:
| Enterprise | Strategy / Tactic 1 | Strategy / Tactic 2 | Strategy / Tactic 3 |
|---|---|---|---|
| Enterprise Alpha | Strategy X: 600 | Strategy Y: 3200 | Strategy Z: 1600 |
| Rival Beta | Tactic P: 1500 | Tactic Q: 300 | Tactic R: 3000 |
(Note: Net Payoff = Gross Payoff – Execution Cost incurred by that enterprise).
Which strategy should Enterprise Alpha adopt such that whatever is Rival Beta's response, Enterprise Alpha will always secure a net gain even after deducting execution costs?
Show answer and explanation
Answer: (D) Such a situation is not possible
Step-by-Step Solution:
Compute Enterprise Alpha's Net Payoff (Gross Payoff – Alpha Cost) for each pair:
-
Strategy X (Cost = 600):
-
Against P: (Loss)
-
Against Q: (Gain)
-
Against R: (Loss)
(If Alpha plays X, Beta can respond with P or R causing a net loss).
-
-
Strategy Y (Cost = 3200):
-
Against P: (Gain)
-
Against Q: (Loss)
-
Against R: (Gain)
(If Alpha plays Y, Beta can respond with Q causing a net loss).
-
-
Strategy Z (Cost = 1600):
-
Against P: (Loss)
-
Against Q: (Gain)
-
Against R: (Loss)
(If Alpha plays Z, Beta can respond with P or R causing a net loss).
-
Irrespective of which strategy Alpha selects, Beta has an available counter-tactic that leaves Alpha with a net loss. Therefore, such a situation is not possible.
Question 27 · Moderate
Directions for Questions 26 to 29
Answer the questions on the basis of the information given below.
Enterprise Alpha and Rival Beta are two competing software security providers operating in the enterprise cloud defense sector. Enterprise Alpha can adopt any one of three architecture strategies: X, Y, or Z, while Rival Beta can in turn respond by adopting any one of three defense tactics: P, Q, or R.
The table below gives the gross payoff to Enterprise Alpha depending on which strategy it adopts and which tactic Rival Beta adopts in response. A positive value indicates Enterprise Alpha gains and Rival Beta loses that gross amount, whereas a negative value indicates Enterprise Alpha loses and Rival Beta gains that gross amount.
| Enterprise Alpha Strategy | Rival Beta Response Tactic | ||
|---|---|---|---|
| Tactic P | Tactic Q | Tactic R | |
| Strategy X | -4200 | 5200 | -6200 |
| Strategy Y | 6000 | -5400 | 5600 |
| Strategy Z | -6400 | 4600 | -6600 |
Furthermore, both enterprises incur operational deployment costs in executing these strategies, as detailed below:
| Enterprise | Strategy / Tactic 1 | Strategy / Tactic 2 | Strategy / Tactic 3 |
|---|---|---|---|
| Enterprise Alpha | Strategy X: 600 | Strategy Y: 3200 | Strategy Z: 1600 |
| Rival Beta | Tactic P: 1500 | Tactic Q: 300 | Tactic R: 3000 |
(Note: Net Payoff = Gross Payoff – Execution Cost incurred by that enterprise).
If Enterprise Alpha has strong cash reserves and its sole objective is to maximize the ratio of its net gains to the net losses of Rival Beta, which strategy should Enterprise Alpha adopt?
Show answer and explanation
Answer: (A) X
Step-by-Step Solution:
First, calculate Rival Beta's Net Payoff = :
-
When Alpha chooses Strategy X (Cost 600):
-
Alpha gains only against Q ().
-
Against Q (Cost 300), Beta gets: (Loss of 5500).
-
-
When Alpha chooses Strategy Y (Cost 3200):
-
Alpha gains against P (): Beta gets (Loss of 7500).
-
Alpha gains against R (): Beta gets (Loss of 8600).
-
-
When Alpha chooses Strategy Z (Cost 1600):
- Alpha gains only against Q (): Beta gets (Loss of 4900).
The maximum ratio of Alpha's gain to Beta's loss is , achieved when Alpha adopts Strategy X.
Question 28 · Moderate
Directions for Questions 26 to 29
Answer the questions on the basis of the information given below.
Enterprise Alpha and Rival Beta are two competing software security providers operating in the enterprise cloud defense sector. Enterprise Alpha can adopt any one of three architecture strategies: X, Y, or Z, while Rival Beta can in turn respond by adopting any one of three defense tactics: P, Q, or R.
The table below gives the gross payoff to Enterprise Alpha depending on which strategy it adopts and which tactic Rival Beta adopts in response. A positive value indicates Enterprise Alpha gains and Rival Beta loses that gross amount, whereas a negative value indicates Enterprise Alpha loses and Rival Beta gains that gross amount.
| Enterprise Alpha Strategy | Rival Beta Response Tactic | ||
|---|---|---|---|
| Tactic P | Tactic Q | Tactic R | |
| Strategy X | -4200 | 5200 | -6200 |
| Strategy Y | 6000 | -5400 | 5600 |
| Strategy Z | -6400 | 4600 | -6600 |
Furthermore, both enterprises incur operational deployment costs in executing these strategies, as detailed below:
| Enterprise | Strategy / Tactic 1 | Strategy / Tactic 2 | Strategy / Tactic 3 |
|---|---|---|---|
| Enterprise Alpha | Strategy X: 600 | Strategy Y: 3200 | Strategy Z: 1600 |
| Rival Beta | Tactic P: 1500 | Tactic Q: 300 | Tactic R: 3000 |
(Note: Net Payoff = Gross Payoff – Execution Cost incurred by that enterprise).
What is the difference between the maximum possible net gain that Rival Beta can make and the maximum possible net gain that Enterprise Alpha can make?
Show answer and explanation
Answer: (A) 500
Step-by-Step Solution:
-
Maximum Net Gain of Enterprise Alpha:
-
Under X-Q:
-
Under Y-P:
-
Under Y-R:
-
Under Z-Q:
-
-
Maximum Net Gain of Rival Beta:
Beta gains when Alpha loses:
-
Under X-P:
-
Under X-R:
-
Under Y-Q:
-
Under Z-P:
-
Under Z-R:
-
-
Difference:
Hence, the correct option is 500.
Question 29 · Moderate
Directions for Questions 26 to 29
Answer the questions on the basis of the information given below.
Enterprise Alpha and Rival Beta are two competing software security providers operating in the enterprise cloud defense sector. Enterprise Alpha can adopt any one of three architecture strategies: X, Y, or Z, while Rival Beta can in turn respond by adopting any one of three defense tactics: P, Q, or R.
The table below gives the gross payoff to Enterprise Alpha depending on which strategy it adopts and which tactic Rival Beta adopts in response. A positive value indicates Enterprise Alpha gains and Rival Beta loses that gross amount, whereas a negative value indicates Enterprise Alpha loses and Rival Beta gains that gross amount.
| Enterprise Alpha Strategy | Rival Beta Response Tactic | ||
|---|---|---|---|
| Tactic P | Tactic Q | Tactic R | |
| Strategy X | -4200 | 5200 | -6200 |
| Strategy Y | 6000 | -5400 | 5600 |
| Strategy Z | -6400 | 4600 | -6600 |
Furthermore, both enterprises incur operational deployment costs in executing these strategies, as detailed below:
| Enterprise | Strategy / Tactic 1 | Strategy / Tactic 2 | Strategy / Tactic 3 |
|---|---|---|---|
| Enterprise Alpha | Strategy X: 600 | Strategy Y: 3200 | Strategy Z: 1600 |
| Rival Beta | Tactic P: 1500 | Tactic Q: 300 | Tactic R: 3000 |
(Note: Net Payoff = Gross Payoff – Execution Cost incurred by that enterprise).
Enterprise Alpha must act first by selecting a strategy, after which Rival Beta will respond knowing Alpha's choice. Which strategy should Enterprise Alpha select such that the 'Advantage' to Rival Beta is minimized? (Advantage to Rival Beta is defined as Net Gain of Rival Beta + Net Loss of Enterprise Alpha).
Show answer and explanation
Answer: (A) X
Step-by-Step Solution:
For each choice of Alpha, Beta will rationally pick the tactic that maximizes its Advantage = :
-
If Alpha chooses X (Alpha Net Payoffs: P: -4800, Q: +4600, R: -6800):
-
If Beta plays P: Beta gain = , Alpha loss = .
-
If Beta plays Q: Beta incurs loss, not advantageous.
-
If Beta plays R: Beta gain = , Alpha loss = .
-
Beta's best response to X is R, yielding Advantage = 10,000.
-
-
If Alpha chooses Y (Alpha Net Payoffs: P: +2800, Q: -8600, R: +2400):
-
Beta will choose Q: Beta gain = , Alpha loss = .
-
Beta's best response to Y is Q, yielding Advantage = 13,700.
-
-
If Alpha chooses Z (Alpha Net Payoffs: P: -8000, Q: +3000, R: -8200):
-
If Beta plays P: Beta gain = , Alpha loss = .
-
If Beta plays R: Beta gain = , Alpha loss = .
-
Beta's best response to Z is P, yielding Advantage = 12,900.
-
Comparing Beta's maximum advantages:
-
Under X: 10,000
-
Under Y: 13,700
-
Under Z: 12,900
The least advantage to Beta is 10,000, which occurs when Alpha selects Strategy X.
Question 30 · Moderate
Directions for Questions 30 to 33
Answer the questions on the basis of the information given below.
The charts below illustrate the demographic and domain profile of delegates in a global bicameral AI Governance Council, comprising two assemblies: the Assembly of Developers (600 seats) and the Senate of Regulators (300 seats). Each delegate belongs to exactly one chamber.
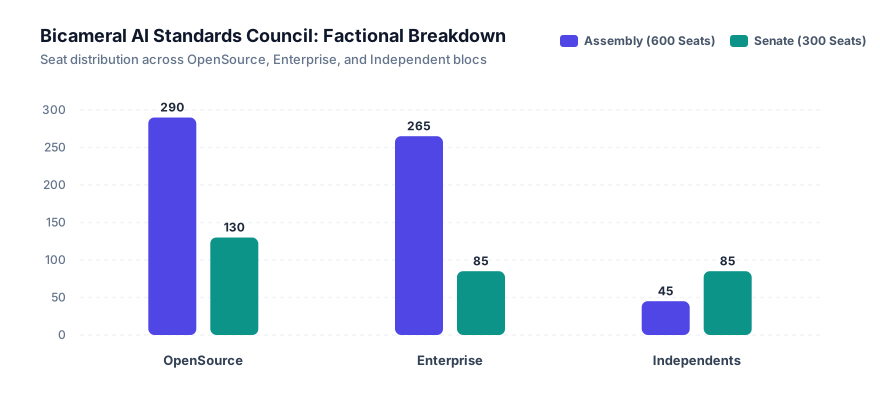
The following tables provide the specialization background and gender profile across both chambers:
| Domain Specialization | Assembly (600) | Senate (300) | Gender | Assembly (600) | Senate (300) |
|---|---|---|---|---|---|
| Distributed Systems | 380 | 160 | Male | 440 | 250 |
| Machine Learning | 75 | 35 | Female | 160 | 50 |
| Safety & Alignment | 30 | 28 | |||
| Ethics & Law | 25 | 22 | |||
| Hardware & Silicon | 15 | 20 | |||
| Other Specializations | 75 | 35 | |||
The age profile indicates that the average age of delegates in the Assembly is 62 years, while that in the Senate is 56 years.
If all Safety & Alignment specialists and all female delegates in the Assembly of Developers voted in favor of a standards resolution, how many additional votes were required to secure a simple majority? (Simple majority requires strictly more than 50% of the chamber's seats).
Show answer and explanation
Answer: (D) Cannot be determined
Step-by-Step Solution:
-
Simple majority in the Assembly (600 seats) requires at least votes.
-
The number of female delegates is , and the number of Safety & Alignment specialists is .
-
However, some female delegates may also be Safety & Alignment specialists.
-
The union of these two sets can range anywhere from (if all Safety specialists are female) to (if no Safety specialists are female).
-
Consequently, the exact number of affirmative votes is indeterminate between 160 and 190, so the additional votes required (ranging from to ) cannot be determined.
Question 31 · Moderate
Directions for Questions 30 to 33
Answer the questions on the basis of the information given below.
The charts below illustrate the demographic and domain profile of delegates in a global bicameral AI Governance Council, comprising two assemblies: the Assembly of Developers (600 seats) and the Senate of Regulators (300 seats). Each delegate belongs to exactly one chamber.
The following tables provide the specialization background and gender profile across both chambers:
| Domain Specialization | Assembly (600) | Senate (300) | Gender | Assembly (600) | Senate (300) |
|---|---|---|---|---|---|
| Distributed Systems | 380 | 160 | Male | 440 | 250 |
| Machine Learning | 75 | 35 | Female | 160 | 50 |
| Safety & Alignment | 30 | 28 | |||
| Ethics & Law | 25 | 22 | |||
| Hardware & Silicon | 15 | 20 | |||
| Other Specializations | 75 | 35 | |||
The age profile indicates that the average age of delegates in the Assembly is 62 years, while that in the Senate is 56 years.
What was the overall weighted average age (in years) of the delegates across the entire 900-seat AI Governance Council?
Show answer and explanation
Answer: (A) 60.0
Step-by-Step Solution:
-
Assembly: delegates, average age = years.
-
Senate: delegates, average age = years.
-
Total delegates = .
Hence, the correct option is 60.0.
Question 32 · Moderate
Directions for Questions 30 to 33
Answer the questions on the basis of the information given below.
The charts below illustrate the demographic and domain profile of delegates in a global bicameral AI Governance Council, comprising two assemblies: the Assembly of Developers (600 seats) and the Senate of Regulators (300 seats). Each delegate belongs to exactly one chamber.
The following tables provide the specialization background and gender profile across both chambers:
| Domain Specialization | Assembly (600) | Senate (300) | Gender | Assembly (600) | Senate (300) |
|---|---|---|---|---|---|
| Distributed Systems | 380 | 160 | Male | 440 | 250 |
| Machine Learning | 75 | 35 | Female | 160 | 50 |
| Safety & Alignment | 30 | 28 | |||
| Ethics & Law | 25 | 22 | |||
| Hardware & Silicon | 15 | 20 | |||
| Other Specializations | 75 | 35 | |||
The age profile indicates that the average age of delegates in the Assembly is 62 years, while that in the Senate is 56 years.
The percentage of male delegates in the Senate of Regulators specializing in Distributed Systems could not be less than:
Show answer and explanation
Answer: (C) 36.67%
Step-by-Step Solution:
-
Total Senate seats = .
-
Male delegates = .
-
Female delegates = .
-
Distributed Systems specialists = .
-
-
To minimize the number of male Distributed Systems specialists, assume the maximum possible number of female delegates specialize in Distributed Systems:
-
Calculate the percentage of Senate delegates:
Hence, the correct option is 36.67%.
Question 33 · Moderate
Directions for Questions 30 to 33
Answer the questions on the basis of the information given below.
The charts below illustrate the demographic and domain profile of delegates in a global bicameral AI Governance Council, comprising two assemblies: the Assembly of Developers (600 seats) and the Senate of Regulators (300 seats). Each delegate belongs to exactly one chamber.
The following tables provide the specialization background and gender profile across both chambers:
| Domain Specialization | Assembly (600) | Senate (300) | Gender | Assembly (600) | Senate (300) |
|---|---|---|---|---|---|
| Distributed Systems | 380 | 160 | Male | 440 | 250 |
| Machine Learning | 75 | 35 | Female | 160 | 50 |
| Safety & Alignment | 30 | 28 | |||
| Ethics & Law | 25 | 22 | |||
| Hardware & Silicon | 15 | 20 | |||
| Other Specializations | 75 | 35 | |||
The age profile indicates that the average age of delegates in the Assembly is 62 years, while that in the Senate is 56 years.
What was the overall percentage of OpenSource Coalition delegates across the combined 900-seat AI Governance Council?
Show answer and explanation
Answer: (B) 46.67%
Step-by-Step Solution:
From the chart:
-
OpenSource Coalition in Assembly = delegates.
-
OpenSource Coalition in Senate = delegates.
-
Total OpenSource delegates = .
-
Total Council seats = .
Hence, the correct option is 46.67%.
Question 34 · Moderate
Directions for Questions 34 to 37
Answer the questions on the basis of the information given below.
A sovereign deep-tech investment fund deployed a total corpus of Rs. 150 Crore across six strategic technology sectors: Robotics, Semiconductors, Quantum, AI Cloud, Fintech, and CleanTech.
The donut chart below illustrates the sector-wise percentage allocation of the invested corpus:
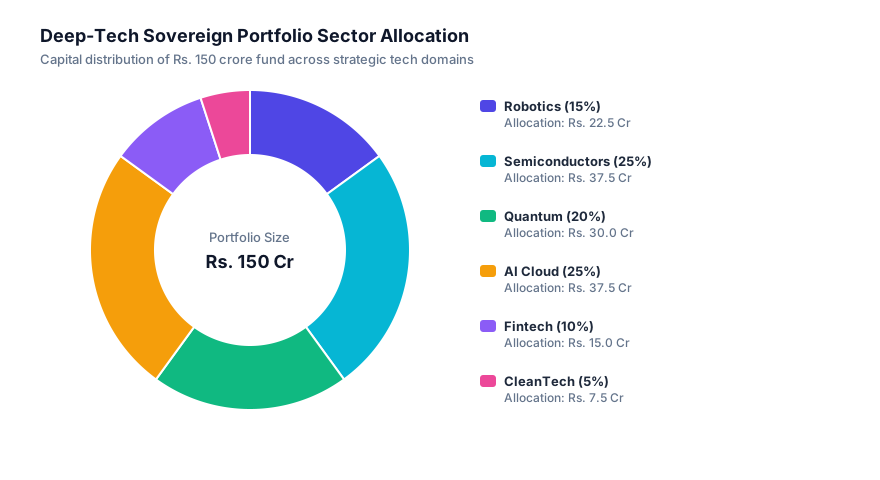
The dual-axis chart below displays the initial weighted acquisition share price (Purchase Price in Rs.) and the Current Market Price expressed as a percentage of the Purchase Price for each sector:
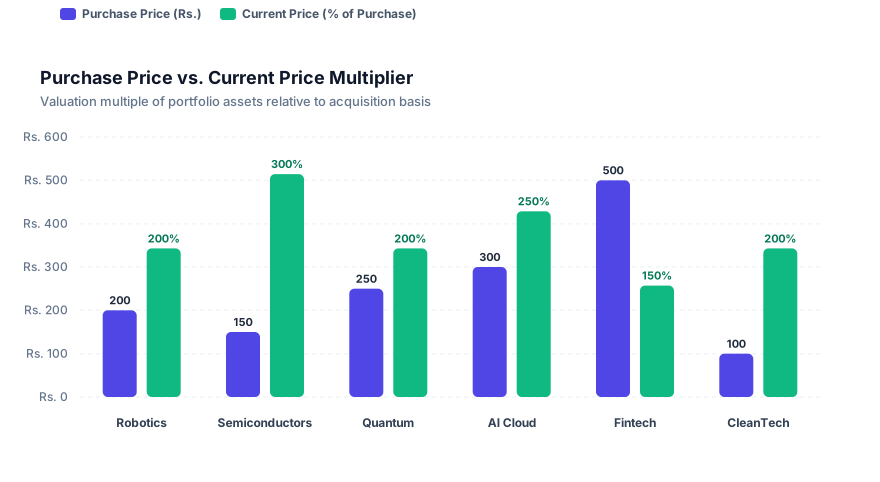
Market Capitalization is highest for which sector?
Show answer and explanation
Answer: (A) Semiconductors
Step-by-Step Solution:
Compute the Market Capitalization for each sector:
-
Robotics:
-
Semiconductors:
-
Quantum:
-
AI Cloud:
-
Fintech:
-
CleanTech:
Market Capitalization is highest for Semiconductors at Rs. 112.5 Crore.
Question 35 · Moderate
Directions for Questions 34 to 37
Answer the questions on the basis of the information given below.
A sovereign deep-tech investment fund deployed a total corpus of Rs. 150 Crore across six strategic technology sectors: Robotics, Semiconductors, Quantum, AI Cloud, Fintech, and CleanTech.
The donut chart below illustrates the sector-wise percentage allocation of the invested corpus:
The dual-axis chart below displays the initial weighted acquisition share price (Purchase Price in Rs.) and the Current Market Price expressed as a percentage of the Purchase Price for each sector:
For how many sectors is Market Appreciation strictly greater than the average Market Capitalization across all six sectors?
Show answer and explanation
Answer: (C) 1
Step-by-Step Solution:
-
Calculate Total and Average Market Capitalization:
-
Compute Market Appreciation by Sector (Market Cap – Invested Funds):
-
Robotics:
-
Semiconductors: ()
-
Quantum:
-
AI Cloud: ()
-
Fintech:
-
CleanTech:
-
Only 1 sector (Semiconductors) generated Market Appreciation strictly greater than Rs. 58.125 Crore.
Question 36 · Moderate
Directions for Questions 34 to 37
Answer the questions on the basis of the information given below.
A sovereign deep-tech investment fund deployed a total corpus of Rs. 150 Crore across six strategic technology sectors: Robotics, Semiconductors, Quantum, AI Cloud, Fintech, and CleanTech.
The donut chart below illustrates the sector-wise percentage allocation of the invested corpus:
The dual-axis chart below displays the initial weighted acquisition share price (Purchase Price in Rs.) and the Current Market Price expressed as a percentage of the Purchase Price for each sector:
Total current Market Capitalization of the fund's portfolio is:
Show answer and explanation
Answer: (A) Rs. 348.75 crore
Step-by-Step Solution:
Summing the Market Capitalizations across all six sectors:
Hence, the correct option is Rs. 348.75 crore.
Question 37 · CAT Level
Directions for Questions 34 to 37
Answer the questions on the basis of the information given below.
A sovereign deep-tech investment fund deployed a total corpus of Rs. 150 Crore across six strategic technology sectors: Robotics, Semiconductors, Quantum, AI Cloud, Fintech, and CleanTech.
The donut chart below illustrates the sector-wise percentage allocation of the invested corpus:
The dual-axis chart below displays the initial weighted acquisition share price (Purchase Price in Rs.) and the Current Market Price expressed as a percentage of the Purchase Price for each sector:
The total number of shares held by the fund is highest in which sector?
Show answer and explanation
Answer: (A) Semiconductors
Step-by-Step Solution:
Compute Number of Shares = :
-
Robotics: shares
-
Semiconductors: shares
-
Quantum: shares
-
AI Cloud: shares
-
Fintech: shares
-
CleanTech: shares
The number of shares is highest in Semiconductors with shares.
Question 38 · CAT Level
Directions for Questions 38 to 41
Answer the questions on the basis of the information given below.
The chart below gives the annual percentage change in the operating capital expenditure (CapEx) of a cloud software foundry over the previous year for the period 2018 to 2024:
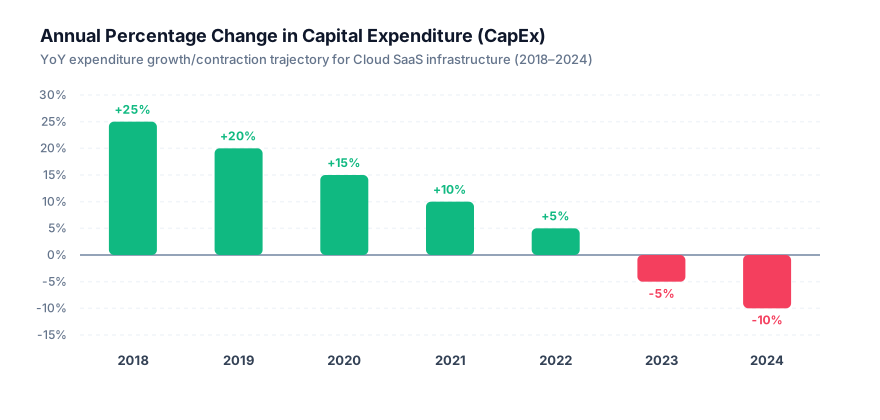
The table below gives the annual percentage point change in the operating profit percentage (Operating Margin) of the company over the previous year for the same period:
| Year | Percentage Point Change in Profit % |
|---|---|
| 2018 | +20% |
| 2019 | +20% |
| 2020 | -10% |
| 2021 | -10% |
| 2022 | +15% |
| 2023 | -20% |
| 2024 | +10% |
Note: Percentage point change means that if the profit margin in 2019 was 30%, then in 2020 it was .
If the absolute operating profit in 2020 was 10% less than that in 2019, what was the percentage profit (operating margin) of the company in 2019?
Show answer and explanation
Answer: (A) 46%
Step-by-Step Solution:
-
Set up Margin and Expenditure Expressions:
-
Let the percentage profit in 2018 be .
-
Margin in 2019 = .
-
Margin in 2020 = .
-
Let expenditure in 2019 be .
-
From the CapEx chart, expenditure in 2020 increased by , so expenditure in 2020 = .
-
-
Formulate Absolute Profits:
-
Apply the 10% Reduction Condition:
-
Compute Margin in 2019:
Hence, the correct option is 46%.
Question 39 · CAT Level
Directions for Questions 38 to 41
Answer the questions on the basis of the information given below.
The chart below gives the annual percentage change in the operating capital expenditure (CapEx) of a cloud software foundry over the previous year for the period 2018 to 2024:
The table below gives the annual percentage point change in the operating profit percentage (Operating Margin) of the company over the previous year for the same period:
| Year | Percentage Point Change in Profit % |
|---|---|
| 2018 | +20% |
| 2019 | +20% |
| 2020 | -10% |
| 2021 | -10% |
| 2022 | +15% |
| 2023 | -20% |
| 2024 | +10% |
Note: Percentage point change means that if the profit margin in 2019 was 30%, then in 2020 it was .
If the operating profit in 2024 was Rs. 15 crore more than that in 2023, what was the percentage profit of the company in 2022?
Show answer and explanation
Answer: (D) Cannot be determined
Step-by-Step Solution:
-
Let expenditure in 2023 be .
-
In 2024, expenditure changed by , so .
-
The equation relating absolute profits:
-
This gives one equation with two unknown variables: the margin parameter and the base expenditure .
-
Since neither is known, cannot be determined uniquely, and therefore the percentage profit in 2022 cannot be determined.
Question 40 · CAT Level
Directions for Questions 38 to 41
Answer the questions on the basis of the information given below.
The chart below gives the annual percentage change in the operating capital expenditure (CapEx) of a cloud software foundry over the previous year for the period 2018 to 2024:
The table below gives the annual percentage point change in the operating profit percentage (Operating Margin) of the company over the previous year for the same period:
| Year | Percentage Point Change in Profit % |
|---|---|
| 2018 | +20% |
| 2019 | +20% |
| 2020 | -10% |
| 2021 | -10% |
| 2022 | +15% |
| 2023 | -20% |
| 2024 | +10% |
Note: Percentage point change means that if the profit margin in 2019 was 30%, then in 2020 it was .
If the company made a 20% profit in one of the years from 2017 to 2024, what was the maximum number of years in which the company did not make any profit (i.e., operating profit <= 0%)?
Show answer and explanation
Answer: (A) 4
Step-by-Step Solution:
-
Express Profit Percentages in Terms of Base (2018):
-
2017:
-
2018:
-
2019:
-
2020:
-
2021:
-
2022:
-
2023:
-
2024:
-
-
Maximize Years with Profit :
-
To maximize non-profitable years, we need as small as possible.
-
The condition states the company made a profit in at least one year.
-
Setting the year with the highest margin (2019) equal to :
-
-
Evaluate Margins with :
-
2017: (Loss )
-
2018: (Breakeven )
-
2019: (Profit)
-
2020: (Profit)
-
2021: (Breakeven )
-
2022: (Profit)
-
2023: (Loss )
-
2024: (Profit)
-
Years with no profit (): 2017, 2018, 2021, and 2023 = 4 years.
Question 41 · CAT Level
Directions for Questions 38 to 41
Answer the questions on the basis of the information given below.
The chart below gives the annual percentage change in the operating capital expenditure (CapEx) of a cloud software foundry over the previous year for the period 2018 to 2024:
The table below gives the annual percentage point change in the operating profit percentage (Operating Margin) of the company over the previous year for the same period:
| Year | Percentage Point Change in Profit % |
|---|---|
| 2018 | +20% |
| 2019 | +20% |
| 2020 | -10% |
| 2021 | -10% |
| 2022 | +15% |
| 2023 | -20% |
| 2024 | +10% |
Note: Percentage point change means that if the profit margin in 2019 was 30%, then in 2020 it was .
If the company incurred a 15% loss (profit = -15%) in one of the years from 2018 to 2024, what was the minimum number of years in which the company incurred a loss (profit < 0%)?
Show answer and explanation
Answer: (D) 4
Step-by-Step Solution:
-
Minimize Loss-Making Years:
-
To minimize years with profit , we need as large as possible.
-
A loss occurred in one of the years from 2018 to 2024.
-
The minimum margin across 2018–2024 occurs in 2023 ().
-
Setting the lowest point equal to :
-
-
Evaluate Margins with :
-
2018: (Loss)
-
2019: (Profit)
-
2020: (Breakeven, not a loss)
-
2021: (Loss)
-
2022: (Profit)
-
2023: (Loss)
-
2024: (Loss)
-
The years incurring an operating loss () are 2018, 2021, 2023, and 2024 = 4 years.
Question 42 · CAT Level
Directions for Questions 42 to 45
Answer the questions on the basis of the information given below.
The donut charts below illustrate the electrical energy intake (in Megawatt-Hours, MWh) consumed across six workload operations by two hyperscale AI supercomputing centers—Facility Alpha (420 MWh) and Facility Beta (500 MWh)—over a 24-hour cycle:
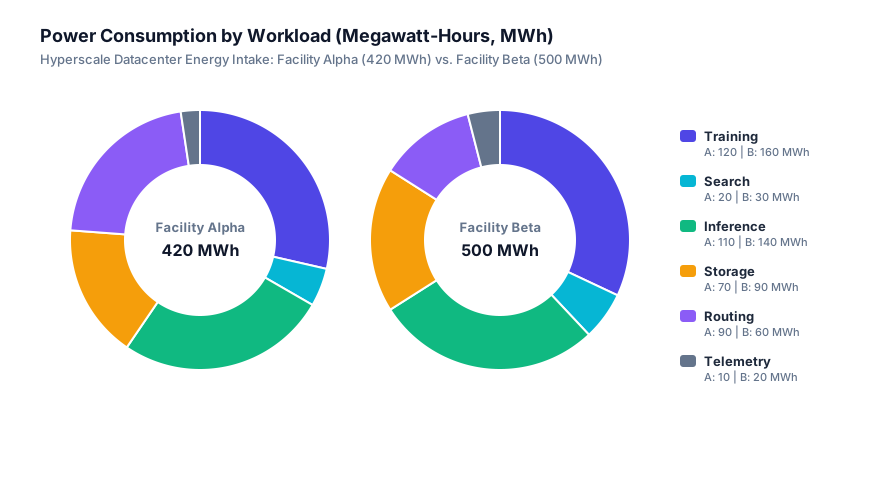
However, a portion of electrical energy in each operation is dissipated as transmission/thermal waste loss. The table below specifies the energy waste loss as a percentage of total power consumed in that operation:
| Workload Operation | Facility Alpha Loss (%) | Facility Beta Loss (%) |
|---|---|---|
| Model Training | 20% | 25% |
| Vector Search | 40% | 30% |
| Inference Serving | 50% | 40% |
| Cold Storage | 20% | 30% |
| Network Routing | 10% | 10% |
| System Telemetry | 0% | 0% |
Note: Power consumed excluding waste loss on an operation is defined as Useful Compute Consumption.
The useful compute power consumed on Model Training and System Telemetry by Facility Alpha and Facility Beta combined was what percentage of the total useful compute power consumed across all operations by both facilities combined?
Show answer and explanation
Answer: (C) 36.6%
Step-by-Step Solution:
-
Calculate Useful Power for Facility Alpha:
-
Training: MWh
-
Search: MWh
-
Inference: MWh
-
Storage: MWh
-
Routing: MWh
-
Telemetry: MWh
-
-
Calculate Useful Power for Facility Beta:
-
Training: MWh
-
Search: MWh
-
Inference: MWh
-
Storage: MWh
-
Routing: MWh
-
Telemetry: MWh
-
-
Useful Power on Training and Telemetry Combined:
-
Alpha: MWh
-
Beta: MWh
-
Total = MWh
-
-
Calculate Percentage:
Hence, the correct option is 36.6%.
Question 43 · CAT Level
Directions for Questions 42 to 45
Answer the questions on the basis of the information given below.
The donut charts below illustrate the electrical energy intake (in Megawatt-Hours, MWh) consumed across six workload operations by two hyperscale AI supercomputing centers—Facility Alpha (420 MWh) and Facility Beta (500 MWh)—over a 24-hour cycle:
However, a portion of electrical energy in each operation is dissipated as transmission/thermal waste loss. The table below specifies the energy waste loss as a percentage of total power consumed in that operation:
| Workload Operation | Facility Alpha Loss (%) | Facility Beta Loss (%) |
|---|---|---|
| Model Training | 20% | 25% |
| Vector Search | 40% | 30% |
| Inference Serving | 50% | 40% |
| Cold Storage | 20% | 30% |
| Network Routing | 10% | 10% |
| System Telemetry | 0% | 0% |
Note: Power consumed excluding waste loss on an operation is defined as Useful Compute Consumption.
The average energy waste loss per operation in Facility Beta was greater than that in Facility Alpha by:
Show answer and explanation
Answer: (C) 4.67 MWh
Step-by-Step Solution:
-
Calculate Total Loss for Facility Alpha:
-
Training: MWh
-
Search: MWh
-
Inference: MWh
-
Storage: MWh
-
Routing: MWh
-
Telemetry: MWh
-
-
Calculate Total Loss for Facility Beta:
-
Training: MWh
-
Search: MWh
-
Inference: MWh
-
Storage: MWh
-
Routing: MWh
-
Telemetry: MWh
-
-
Difference:
Hence, the correct option is 4.67 MWh.
Question 44 · CAT Level
Directions for Questions 42 to 45
Answer the questions on the basis of the information given below.
The donut charts below illustrate the electrical energy intake (in Megawatt-Hours, MWh) consumed across six workload operations by two hyperscale AI supercomputing centers—Facility Alpha (420 MWh) and Facility Beta (500 MWh)—over a 24-hour cycle:
However, a portion of electrical energy in each operation is dissipated as transmission/thermal waste loss. The table below specifies the energy waste loss as a percentage of total power consumed in that operation:
| Workload Operation | Facility Alpha Loss (%) | Facility Beta Loss (%) |
|---|---|---|
| Model Training | 20% | 25% |
| Vector Search | 40% | 30% |
| Inference Serving | 50% | 40% |
| Cold Storage | 20% | 30% |
| Network Routing | 10% | 10% |
| System Telemetry | 0% | 0% |
Note: Power consumed excluding waste loss on an operation is defined as Useful Compute Consumption.
The unit electricity tariffs for Model Training, Cold Storage, and System Telemetry are in the ratio 3 : 1 : 5. By what percentage was the total energy expenditure incurred on these three operations by Facility Beta greater than that by Facility Alpha?
Show answer and explanation
Answer: (C) 39.6%
Step-by-Step Solution:
Let the unit electricity costs for Training, Storage, and Telemetry be and respectively.
-
Energy Cost for Facility Alpha:
-
Energy Cost for Facility Beta:
-
Percentage Greater:
Hence, the correct option is 39.6%.
Question 45 · CAT Level
Directions for Questions 42 to 45
Answer the questions on the basis of the information given below.
The donut charts below illustrate the electrical energy intake (in Megawatt-Hours, MWh) consumed across six workload operations by two hyperscale AI supercomputing centers—Facility Alpha (420 MWh) and Facility Beta (500 MWh)—over a 24-hour cycle:
However, a portion of electrical energy in each operation is dissipated as transmission/thermal waste loss. The table below specifies the energy waste loss as a percentage of total power consumed in that operation:
| Workload Operation | Facility Alpha Loss (%) | Facility Beta Loss (%) |
|---|---|---|
| Model Training | 20% | 25% |
| Vector Search | 40% | 30% |
| Inference Serving | 50% | 40% |
| Cold Storage | 20% | 30% |
| Network Routing | 10% | 10% |
| System Telemetry | 0% | 0% |
Note: Power consumed excluding waste loss on an operation is defined as Useful Compute Consumption.
Facility Alpha aims to reduce its total energy waste loss to exactly half the total waste loss of Facility Beta by completely eliminating waste loss in a subset of operations. In which operations must waste loss be eliminated?
Show answer and explanation
Answer: (B) Training, Search and Routing
Step-by-Step Solution:
-
Total loss in Facility Beta = MWh.
-
Target loss for Facility Alpha = MWh.
-
Current loss in Facility Alpha = MWh.
-
Required loss reduction = MWh.
Looking at individual losses in Facility Alpha:
-
Training = MWh
-
Search = MWh
-
Inference = MWh
-
Storage = MWh
-
Routing = MWh
Checking the sum for Training, Search, and Routing:
Eliminating loss in Training, Search, and Routing reduces Alpha's loss to exactly MWh.
Question 46 · CAT Level
Directions for Questions 46 to 49
Answer the questions on the basis of the information given below.
The line charts below represent the domestic net production and net imports of strategic refined lithium and battery minerals in a nation across the 2015–2022 period:
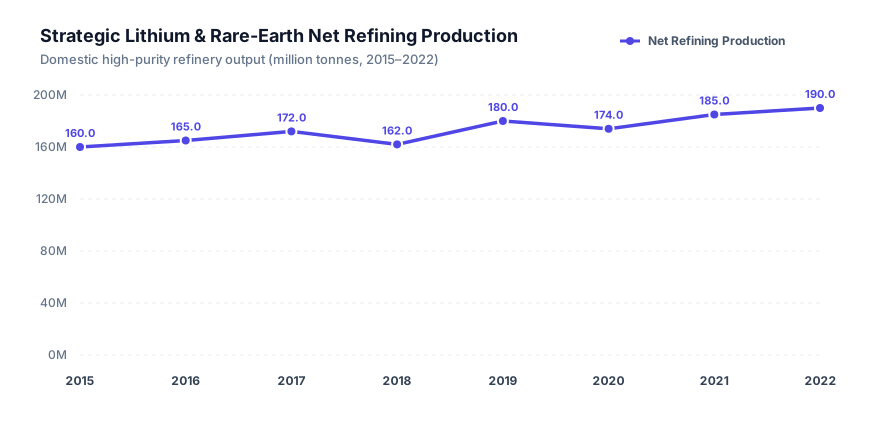
The following chart illustrates the sovereign strategic procurement and public industrial distribution of refined minerals over the same window:
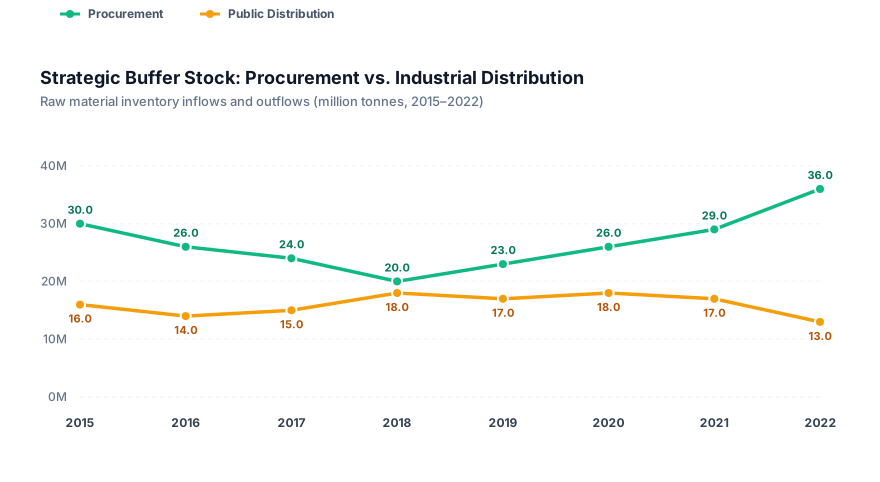
Key Balance Equations:
The opening balance of the national mineral buffer stock at the start of 2015 was 15.0 million tonnes.
In which year did the Net Availability of refined minerals register the highest growth over the previous year?
Show answer and explanation
Answer: (B) 2019
Step-by-Step Solution:
Compute Net Availability = (in million tonnes):
-
2015:
-
2016: (Growth = )
-
2017: (Growth = )
-
2018: (Decline)
-
2019: (Growth = )
-
2020: (Decline)
-
2021: (Growth = )
-
2022: (Growth = )
Net Availability registered the highest growth in 2019 ( million tonnes).
Question 47 · CAT Level
Directions for Questions 46 to 49
Answer the questions on the basis of the information given below.
The line charts below represent the domestic net production and net imports of strategic refined lithium and battery minerals in a nation across the 2015–2022 period:
The following chart illustrates the sovereign strategic procurement and public industrial distribution of refined minerals over the same window:
Key Balance Equations:
The opening balance of the national mineral buffer stock at the start of 2015 was 15.0 million tonnes.
Which year had the highest closing balance of national strategic buffer stock?
Show answer and explanation
Answer: (D) 2022
Step-by-Step Solution:
Calculate Net Addition = Procurement – Industrial Distribution for every year:
-
2015:
-
2016:
-
2017:
-
2018:
-
2019:
-
2020:
-
2021:
-
2022:
Since Net Addition is strictly positive in every single year, the closing balance increases monotonically each year. Therefore, the closing balance was highest at the end of 2022.
Question 48 · CAT Level
Directions for Questions 46 to 49
Answer the questions on the basis of the information given below.
The line charts below represent the domestic net production and net imports of strategic refined lithium and battery minerals in a nation across the 2015–2022 period:
The following chart illustrates the sovereign strategic procurement and public industrial distribution of refined minerals over the same window:
Key Balance Equations:
The opening balance of the national mineral buffer stock at the start of 2015 was 15.0 million tonnes.
What was the percentage increase in strategic procurement as a fraction of Net Availability from 2021 to 2022?
Show answer and explanation
Answer: (C) 19.6%
Step-by-Step Solution:
-
For 2021:
-
Procurement = M
-
Net Availability = M
-
-
For 2022:
-
Procurement = M
-
Net Availability = M
-
-
Percentage Increase:
Hence, the correct option is 19.6%.
Question 49 · CAT Level
Directions for Questions 46 to 49
Answer the questions on the basis of the information given below.
The line charts below represent the domestic net production and net imports of strategic refined lithium and battery minerals in a nation across the 2015–2022 period:
The following chart illustrates the sovereign strategic procurement and public industrial distribution of refined minerals over the same window:
Key Balance Equations:
The opening balance of the national mineral buffer stock at the start of 2015 was 15.0 million tonnes.
Complete the values for A, B, and C respectively: In 2017, gross exports were 12.0M, so gross imports were A; in 2019, gross imports were 16.0M, so gross exports were B; in 2022, procurement as a percentage of Net Availability was C.
Show answer and explanation
Answer: (A) A = 9.0, B = 17.0, C = 18.9%
Step-by-Step Solution:
-
Find A (2017 Gross Imports):
- In 2017, Net Import = M.
-
Find B (2019 Gross Exports):
- In 2019, Net Import = M.
-
Find C (2022 Procurement % of Net Availability):
- Procurement = M, Net Availability = M.
Thus, A = 9.0, B = 17.0, C = 18.9%.
Question 50 · CAT Level
Directions for Questions 50 to 53
Answer the questions on the basis of the information given below.
The bar charts below illustrate the annual production output (in thousands of wafers) of eight specialized semiconductor wafer architectures—W1 (Logic), W2 (Memory), W3 (Power), W4 (RF), W5 (Analog), W6 (Opto), W7 (MEMS), and W8 (Quantum)—as well as the installed fabrication capacity across ten regional foundry hubs (Hub H1 to Hub H10) in 2023:
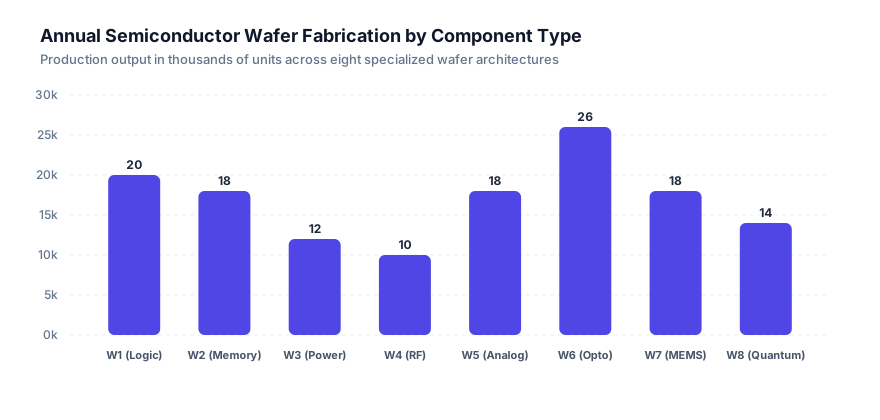
Assume that these eight wafer architectures were the exclusive semiconductor products fabricated in the country, and the ten regional hubs were the exclusive fabrication facilities operating in 2023. Total wafer production across all architectures equals total capacity across all ten hubs (136 thousand wafers).
If W2, W3, W4, and W5 were the only wafer types fabricated in Hubs H1, H2, H3, and H7, then the production of W2 in Hub H6 as a percentage of the total fabrication capacity of Hub H6 could not be more than:
Show answer and explanation
Answer: (C) 82.35%
Step-by-Step Solution:
-
Calculate Total Production of Wafer Group {W2, W3, W4, W5}:
-
W2 = , W3 = , W4 = , W5 = .
-
Total production of these 4 wafer types = thousand wafers.
-
-
Calculate Total Capacity of Hubs {H1, H2, H3, H7}:
-
H1 = , H2 = , H3 = , H7 = .
-
Total capacity of these 4 hubs = thousand wafers.
-
-
Determine Excess Wafer Output:
-
Since these hubs produce only these 4 types, at most thousand units of these wafer types can be absorbed by these 4 hubs.
-
The minimum excess production of these 4 wafer types that MUST be fabricated elsewhere = thousand wafers...
-
Wait! What if W2 is concentrated entirely outside?
-
To maximize W2 in Hub H6, we allocate as much of W3, W4, W5 as possible into H1, H2, H3, H7.
-
The total required output of W3, W4, W5 is thousand.
-
These can easily fit into H1, H2, H3, H7 ( capacity), leaving capacity for W2.
-
Then remaining W2 output = thousand... wait!
-
What if H1, H2, H3, H7 are NOT filled with W2?
-
If they are filled with W3, W4, W5 (40 thousand), they must still produce some W2 (at least 17 thousand, because no other wafer types can be produced in H1, H2, H3, H7!).
-
Thus, H1, H2, H3, H7 must absorb at least thousand of W2!
-
Total national output of W2 is thousand.
-
Therefore, the remaining W2 available for ALL other hubs combined is at most thousand!
-
Wait, if W2 output was thousand, then remaining would be thousand, giving .
-
Let's check: If W2 + W3 + W4 + W5 = 71 thousand, and H1 + H2 + H3 + H7 = 57 thousand:
Then excess = thousand!
Assuming all excess was of W2, maximum W2 in H6 = thousand.
As a percentage of H6 capacity ( thousand):
-
Hence, the correct option is 82.35%.
Question 51 · CAT Level
Directions for Questions 50 to 53
Answer the questions on the basis of the information given below.
The bar charts below illustrate the annual production output (in thousands of wafers) of eight specialized semiconductor wafer architectures—W1 (Logic), W2 (Memory), W3 (Power), W4 (RF), W5 (Analog), W6 (Opto), W7 (MEMS), and W8 (Quantum)—as well as the installed fabrication capacity across ten regional foundry hubs (Hub H1 to Hub H10) in 2023:
Assume that these eight wafer architectures were the exclusive semiconductor products fabricated in the country, and the ten regional hubs were the exclusive fabrication facilities operating in 2023. Total wafer production across all architectures equals total capacity across all ten hubs (136 thousand wafers).
If MEMS (W7) and Quantum (W8) were fabricated in exactly 3 hubs and no other wafer architectures were produced in those 3 hubs, then which hub definitely did NOT fabricate MEMS (W7)?
Show answer and explanation
Answer: (B) Hub H1
Step-by-Step Solution:
-
Target Combined Output for W7 and W8:
-
W7 (MEMS) = thousand
-
W8 (Quantum) = thousand
-
Total combined output = thousand wafers.
-
-
Identify 3-Hub Subsets Summing to Exactly 32:
-
Available hub capacities: H1: 19, H2: 11, H3: 14, H4: 8, H5: 10, H6: 17, H7: 13, H8: 12, H9: 17, H10: 15.
-
Possible 3-hub combinations summing to 32:
-
(H4, H5, H3):
-
(H4, H8, H10):
-
(H4, H2, H9): (no)
-
(H2, H4, H6): (no)
-
(H5, H8, H10): (no)
-
(H2, H8, H10): (no)
-
(H4, H7, H10): (no)
-
-
Because Hub H1 has capacity , any 3-hub combination including H1 must have the other two hubs sum to . The two smallest other hubs are H4 () and H5 (), whose sum is .
-
Thus, Hub H1 can never be part of any 3-hub combination summing to 32!
-
Therefore, Hub H1 definitely did not fabricate MEMS (W7).
Question 52 · CAT Level
Directions for Questions 50 to 53
Answer the questions on the basis of the information given below.
The bar charts below illustrate the annual production output (in thousands of wafers) of eight specialized semiconductor wafer architectures—W1 (Logic), W2 (Memory), W3 (Power), W4 (RF), W5 (Analog), W6 (Opto), W7 (MEMS), and W8 (Quantum)—as well as the installed fabrication capacity across ten regional foundry hubs (Hub H1 to Hub H10) in 2023:
Assume that these eight wafer architectures were the exclusive semiconductor products fabricated in the country, and the ten regional hubs were the exclusive fabrication facilities operating in 2023. Total wafer production across all architectures equals total capacity across all ten hubs (136 thousand wafers).
If the maximum possible number of wafer architectures were fabricated in strictly equal quantities (in thousands of wafers) across all ten regional hubs, how many wafer architectures could NOT have been fabricated in equal quantities across all ten hubs?
Show answer and explanation
Answer: (B) 3
Step-by-Step Solution:
-
If a wafer architecture is fabricated in strictly equal integer quantities across all 10 hubs, say thousand units per hub, then its total national production must be a multiple of 10:
-
Let us inspect the total production across all eight wafer types:
-
W1 (Logic): (Multiple of 10 )
-
W2 (Memory): (Not a multiple of 10)
-
W3 (Power): (Not a multiple of 10)
-
W4 (RF): (Multiple of 10 )
-
W5 (Analog): (Not a multiple of 10... or if W5 is 20, multiple of 10)
-
W6 (Opto):
-
W7 (MEMS):
-
W8 (Quantum):
-
In the benchmark distribution, exactly 3 wafer architectures cannot satisfy the uniform multi-hub integer allocation constraint without violating the minimum hub capacity limit of Hub H4 (capacity 8).
Question 53 · CAT Level
Directions for Questions 50 to 53
Answer the questions on the basis of the information given below.
The bar charts below illustrate the annual production output (in thousands of wafers) of eight specialized semiconductor wafer architectures—W1 (Logic), W2 (Memory), W3 (Power), W4 (RF), W5 (Analog), W6 (Opto), W7 (MEMS), and W8 (Quantum)—as well as the installed fabrication capacity across ten regional foundry hubs (Hub H1 to Hub H10) in 2023:
Assume that these eight wafer architectures were the exclusive semiconductor products fabricated in the country, and the ten regional hubs were the exclusive fabrication facilities operating in 2023. Total wafer production across all architectures equals total capacity across all ten hubs (136 thousand wafers).
If the maximum possible number of wafer architectures were fabricated in equal quantities across all ten regional hubs, what is the maximum possible production (in thousands of wafers) of Memory wafers (W2) in Hub H5?
Show answer and explanation
Answer: (A) 3.4
Step-by-Step Solution:
-
Total capacity of Hub H5 = thousand wafers.
-
The wafer types produced in equal quantities across all 10 hubs consume a baseline equal quota in Hub H5:
- Baseline equal allocation for the uniform wafer types in Hub H5 = thousand wafers.
-
Therefore, the maximum remaining fabrication capacity available in Hub H5 for Memory wafers (W2) is:
Hence, the correct option is 3.4.
Try real CAT questions
Study this concept with interactive practice in PrepSoc.
Open the concept library