CAT 2024 Slot 3 DILR Q19
- Data Interpretation and Logical Reasoning
- Data Interpretation › Tables
- Medium
- Type in the answer (TITA)
- CAT_2024_SLOT3_DILR_Q19
Data set · questions 19–22
The table given below shows the amount, in grams, of carbohydrate, protein, fat and all other nutrients, per 100 grams of nutrients in seven food grains. The first column shows the foodgrain category and the second column its codename. The table has some missing values.
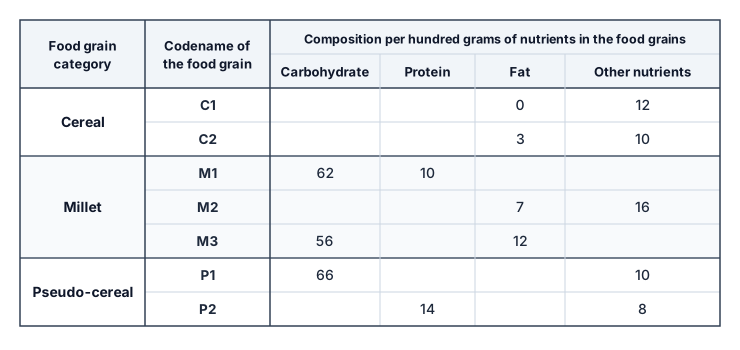
The following additional facts are known.
- Both the pseudo-cereals had higher amounts of carbohydrate as well as higher amounts of protein than any millet.
- Both the cereals had higher amounts of carbohydrate than any pseudo-cereal.
- All the missing values of carbohydrate amounts (in grams) for all the foodgrains are non-zero multiples of 5.
- All the missing values of protein, fat and other nutrients amounts (in grams) for all the foodgrains are non-zero multiples of 4.
- P1 contained double the amount of protein that M3 contains.
Question 19
How many foodgrains had a higher amount of carbohydrate per 100 grams of nutrients than M1?
Type-in-the-answer (TITA) question: no options are given; enter the value.
Show answer and solution
Answer:
5
Solution
Concept: Multi-Attribute Nutritional Optimization & Linear Constraints
Master State Table
| Foodgrain Category | Codename | Carbohydrate () | Protein () | Fat () | Other Nutrients () | Row Total () |
|---|---|---|---|---|---|---|
| Cereal | C1 | 80 | 8 | 0 | 12 | 100 |
| Cereal | C2 | 75 | 12 | 3 | 10 | 100 |
| Pseudo-Cereal | P1 | 66 | 16 | 8 | 10 | 100 |
| Pseudo-Cereal | P2 | 65 | 14 | 5 | 16 | 100 |
| Millet | M1 | 62 | 10 | 20 | 8 | 100 |
| Millet | M2 | 65 | 12 | 7 | 16 | 100 |
| Millet | M3 | 60 | 8 | 8 | 24 | 100 |
Question Deduction
We count how many foodgrains had a strictly higher amount of carbohydrate per 100 grams of nutrients than foodgrain .
• Extracting Baseline Carbohydrate Amount:
• From the Master State Table, the carbohydrate content of is explicitly:
• Comparative Analysis Across All Foodgrains:
• : (Higher)
• : (Higher)
• : (Higher)
• : (Higher)
• : (Higher)
• : (Lower)
• Conclusion:
Exactly five foodgrains ( and ) have a higher carbohydrate content than .
Therefore, the number of foodgrains is 5.
Topper Take
• Direct Rank Tally: Once the carbohydrate column is filled (), simply compare against . The only grain strictly lower than is ().
Other questions in this set
- Q20. How many grams of protein were there in 100 grams of nutrients in M2?
- Q21. How many grams of other nutrients were there in 100 grams of nutrients in M3?
- Q22. What is the median of the number of grams of protein in 100 grams of nutrients among these food grains?
Tables questions from other CAT papers
- CAT 2023 Slot 1 DILR Q6
- CAT 2023 Slot 1 DILR Q7
- CAT 2023 Slot 1 DILR Q8
- CAT 2023 Slot 1 DILR Q9
- CAT 2023 Slot 1 DILR Q10
Practise this question with timing, notes and your mistake notebook.
Practise in PrepSoc