CAT 2024 Slot 3 DILR Q11
- Data Interpretation and Logical Reasoning
- Data Interpretation › Tables
- Hard
- Multiple choice
- CAT_2024_SLOT3_DILR_Q11
Data set · questions 10–13
Out of countries -- Country through Country -- Country has the highest gross domestic product (GDP), and Country has the highest GDP per capita. GDP per capita is the GDP of a country divided by its population. The table below provides the following data about Country through Country for the year .
-
Column gives the country's identity.
-
Column gives the country's GDP as a fraction of the GDP of Country 9.
-
Column gives the country's GDP per capita as a fraction of the GDP per capita of Country10.
-
Column gives the country's annual GDP growth rate.
-
Column gives the country's annual population growth rate.
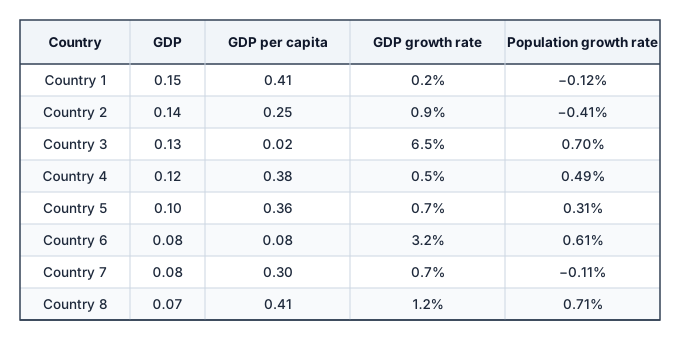
Assume that the GDP growth rates and population growth rates of the countries will remain constant for the next three years.
Question 11
The ratio of Country 4’s GDP to Country 5’s GDP in 2026 will be closest to
Show answer and solution
Answer: (B)
1.195
Solution
Concept: Constrained Macroeconomic Ratios & Relative Comparisons
Master State Table
| Country | GDP (vs C9) | GDP/Capita (vs C10) | Relative Pop. (2024) | Annual GDP Growth | Annual Pop. Growth |
|---|---|---|---|---|---|
| Country 1 | 0.15 | 0.41 | |||
| Country 2 | 0.14 | 0.25 | |||
| Country 3 | 0.13 | 0.02 | |||
| Country 4 | 0.12 | 0.38 | |||
| Country 5 | 0.10 | 0.36 | |||
| Country 6 | 0.08 | 0.08 | |||
| Country 7 | 0.08 | 0.30 | |||
| Country 8 | 0.07 | 0.41 |
Question Deduction
• Time Horizon & Parameters: Base year 2024 to target year 2026 implies years.
• Country 4: , growth rate .
• Country 5: , growth rate .
• Projected GDP in 2026:
•
•
• GDP Ratio Derivation:
• High-Yield Calculation:
• Exact value: .
• First-order differential shortcut: .
• Final Selection: Closest value is (Option 2).
Topper Take
• Differential Growth Shortcut: Base ratio is . Since Country 5 grows faster by , Country 4 loses over 2 years: .
Other questions in this set
- Q10. Which one among the countries 1 through 8, has the smallest population in 2024?
- Q12. Which one among the countries 1, 4, 5, and 7 will have the largest population in 2027?
- Q13. For how many countries among Country 1 through Country 8 will the GDP per capita in 2027 be lower than that in 2024?
Tables questions from other CAT papers
- CAT 2023 Slot 1 DILR Q6
- CAT 2023 Slot 1 DILR Q7
- CAT 2023 Slot 1 DILR Q8
- CAT 2023 Slot 1 DILR Q9
- CAT 2023 Slot 1 DILR Q10
Practise this question with timing, notes and your mistake notebook.
Practise in PrepSoc