CAT 2019 Slot 2 DILR Q3
- Data Interpretation and Logical Reasoning
- Data Interpretation › Radar Chart
- Medium
- Type in the answer (TITA)
- CAT_2019_SLOT2_DILR_Q03
Data set · questions 1–4
A large store has only three departments, Clothing, Produce, and Electronics. The following figure shows the percentages of revenue an cost from the three departments for the years 2016, and 2018. The dotted lines depict percentage levels. So for example, in 2016, of store's revenue came from its Electronics department while of its costs were incurred in the Produce department.
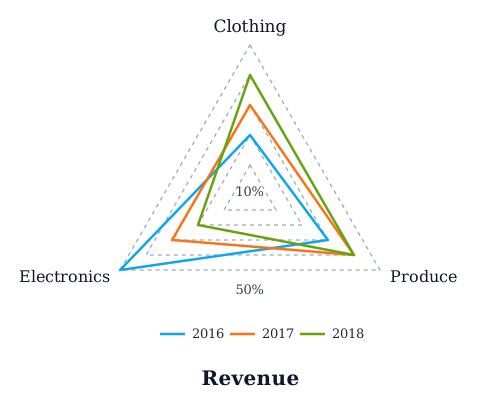
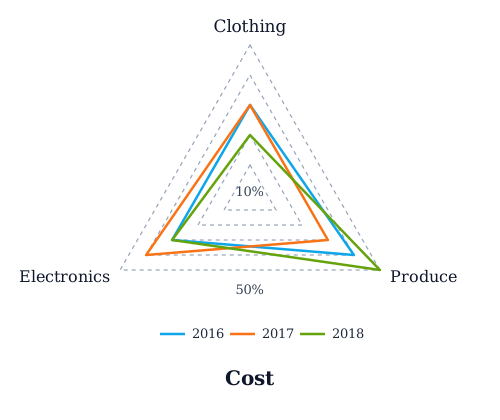
In this setup, Profit is computed as (Revenue - Cost) and Percentage Profit as Profit/Cost .
It is known that
-
The percentage profit for the store in was .
-
The store's revenue doubled from to 2017, and its cost doubled from to .
-
There was no profit from the Electronics department in .
-
In 2018, the revenue from the Clothing department was the same as the cost incurred in the Produce department.
Question 3
What percentage of the total profits for the store in was from the Electronics department?
Type-in-the-answer (TITA) question: no options are given; enter the value.
Show answer and solution
Answer:
70
Solution
Concept: Departmental Profit Decomposition & Component Contribution Ratio
Master State Table
| Year & Metric | Clothing | Produce | Electronics | Total Store | Profit Margin |
|---|---|---|---|---|---|
| 2016 Revenue | 40 (20%) | 60 (30%) | 100 (50%) | 200 (100%) | — |
| 2016 Cost | 30 (30%) | 40 (40%) | 30 (30%) | 100 (100%) | — |
| 2016 Profit | +10 | +20 | +70 | +100 | +100.0% |
| 2017 Revenue | 120 (30%) | 160 (40%) | 120 (30%) | 400 (100%) | — |
| 2017 Cost | 90 (30%) | 90 (30%) | 120 (40%) | 300 (100%) | — |
| 2017 Profit | +30 | +70 | 0 | +100 | +33.33% |
| 2018 Revenue | 100 (40%) | 100 (40%) | 50 (20%) | 250 (100%) | — |
| 2018 Cost | 40 (20%) | 100 (50%) | 60 (30%) | 200 (100%) | — |
| 2018 Profit | +60 | 0 | -10 | +50 | +25.0% |
Question Deduction
• 2016 Baseline Parameters & Total Profit:
• Setting base total cost in index units.
• Clue 1 states that the store achieved a %:
63231R_{2016} = C_{2016} \times (1 + 1.00) = 20063231
• Total store profit in $ is:
63231\text{Total Profit}_{2016} = R_{2016} - C_{2016} = 200 - 100 = 10063231
• Electronics Department Profit Breakdown:
• From the of total revenue:
63231R_{\text{Electronics}, 2016} = 50\% \times 200 = 10063231
• From the of total cost:
63231C_{\text{Electronics}, 2016} = 30\% \times 100 = 3063231
• Profit generated specifically by Electronics:
63231\text{Profit}_{\text{Electronics}, 2016} = 100 - 30 = 7063231
• Contribution Percentage & Cross-Check:
• Computing Electronics share of the store's total profit:
63231\text{Contribution} = \frac{\text{Profit}_{\text{Electronics}, 2016}}{\text{Total Profit}_{2016}} \times 100\% = \frac{70}{100} \times 100\% = 70\%63231
• Conservation check: Clothing profit is - 30 = 10) and Produce profit is - 40 = 20); their sum + 20 + 70 = 100$ confirms total consistency.
• Option Matching / Numerical Answer:
• The Electronics department contributed exactly %.
• Confirms numerical TITA answer of $.
Topper Take
• Normalizing base cost to , so any department's absolute profit index directly equals its percentage share of total profit.
• Direct mental math: {\text{Electronics}} = 0.50 \times 200 = 100 in under 20 seconds.
Other questions in this set
- Q1. What was the percentage profit of the store in 2018 ?
- Q2. What was the ratio of revenue generated from the Produce department in 2017 to that in 2018?
- Q4. What was the approximate difference in profit percentages of the store in 2017 and 2018?
Practise this question with timing, notes and your mistake notebook.
Practise in PrepSoc